WRITING AN EQUATION OF PARABOLA USIGN VERTEX AND A POINT
Subscribe to our ▶️ YouTube channel 🔴 for the latest videos, updates, and tips.
To find equation of parabola from the given vertex and a point, we may use vertex form of the parabola.
y = a(x - h)2 + k
Here (h, k) is the vertex.
To find the value of a, we can apply the given point into the equation instead of (x, y).
Problem 1 :
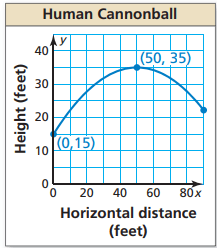
The graph shows the parabolic path of a performer who is shot out of a cannon, where y is the height (in feet) and x is the horizontal distance traveled (in feet). Write an equation of the parabola. The performer lands in a net 90 feet from the cannon. What is the height of the net?

Solution :
By observing the parabola shown above, we come to know that vertex of the parabola is (50, 35) and it passes through the point (0, 15).
y = a(x - h)2 + k
Applying the vertex (50, 35)
y = a(x - 50)2 + 35 ---(1)
Since the curve is passing through the point (0, 15), we can apply x = 0 and y = 15
15 = a(0 - 50)2 + 35
15 = a(2500) + 35
15 - 35 = a(2500)
-20 = a(2500)
a = -20/2500
a = -1/125
a = -0.008
Applying the value of a in (1), we get
y = -0.008(x - 50)2 + 35
Applying x = 90, we get
y = -0.008(90 - 50)2 + 35
y = -0.008(40)2 + 35
y = -12.8 + 35
y = 22.2
So, the height is 22.2 feet.
Problem 2 :
Write an equation of the parabola that passes through the point (−1, 2) and has vertex (4, −9)
Solution :
y = a(x - h)2 + k
Vertex (h, k) ==> (4, -9)
y = a(x - 4)2 + (-9)
y = a(x - 4)2 - 9 ----(1)
Since it passes through the point (-1, 2), we get
2 = a(-1 - 4)2 - 9
11 = a(25)
a = 11/25
a = 0.44
Applying the value of a in (1),
y = 0.44(x - 4)2 - 9
Problem 3 :
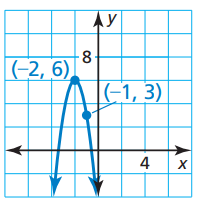
Write the equation of parabola shown in the graph below.

Solution :
y = a(x - h)2 + k
Vertex (h, k) ==> (-2, 6)
y = a(x - (-2))2 + 6
y = a(x + 2)2 + 6 ----(1)
Since it passes through the point (-1, 3), we get
3 = a(-1 + 2)2 + 6
3 = 1a + 6
a = -3
Applying the value of a, we get
y = -3(x + 2)2 + 6
So, the required equation representing the parabola given above is
y = -3(x + 2)2 + 6
Problem 4 :
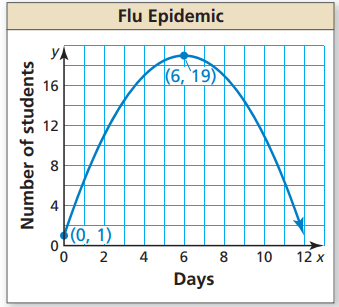
The graph shows the number y of students absent from school due to the flu each day x.

a. Interpret the meaning of the vertex in this situation.
b. Write an equation for the parabola to predict the number of students absent on day 10.
c. Compare the average rates of change in the students with the flu from 0 to 6 days and 6 to 11 days.
Solution :
y = a(x - h)2 + k
Vertex (h, k) ==> (6, 19)
y = a(x - 6)2 + 19 ----(1)
Since it passes through the point (0, 1), we get
1 = a(0 - 6)2 + 19
1 - 19 = 36a
a = -18/36
a = -1/2
Applying the value of a, we get
y = -(1/2)(x - 6)2 + 19
So, the required equation representing the parabola given above is
y = -(1/2)(x - 6)2 + 19
i) On the 6th day, maximum number of students are affected by flu
ii) y = -(1/2)(x - 6)2 + 19
On day 10, number of students absent = ?
When x = 10, y = ?
y = -(1/2)(10 - 6)2 + 19
y = (-1/2) 16 + 19
y = -8 + 19
y = 11
So, number of students absent on day 10 is 11 students.
c) By observing the graph, the curve is increasing from 0 days to 6 days. So, we can understand that the number of students affected is increasing. After 6 days upto 19 days since the curve is decreasing, the number of students affected is decreasing.
Subscribe to our ▶️ YouTube channel 🔴 for the latest videos, updates, and tips.
Recent Articles
-
Finding Range of Values Inequality Problems
May 21, 24 08:51 PM
Finding Range of Values Inequality Problems -
Solving Two Step Inequality Word Problems
May 21, 24 08:51 AM
Solving Two Step Inequality Word Problems -
Exponential Function Context and Data Modeling
May 20, 24 10:45 PM
Exponential Function Context and Data Modeling