WRITE THE INEQUALITY REPRESENTED BY THE GRAPH
Subscribe to our ▶️ YouTube channel 🔴 for the latest videos, updates, and tips.
There are four inequalities signs are used.
Less than :
For example, x < 3 means
The values of x should be lesser than 3.
Greater than :
For example, x > 3 means
The values of x should be greater than 3.
Lesser than or equal :
For example, x ≤ 3 means
The values of x should be lesser than or equal to 3.
greater than or equal :
For example, x ≥ 3 means
The values of x should be greater than or equal to 3.
Write down the inequality which describes the region shown in each diagram.
Problem 1 :
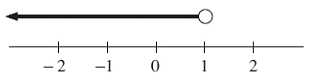
Solution :
At the top of 1, we have empty circle. So, we are allowed to use < or > sign.
What are the solutions ?
All values which are less than 1 can be considered as solution. So, the required inequality represented by the graph is
x < 1
Interval notation :
(-∞, 1)
Problem 2 :
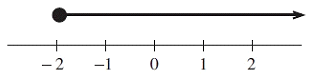
Solution :
At the top of -2, we have a solid circle. So, we are allowed to use ≤ or ≥ sign.
What are the solutions ?
All values which are greater than -2 can be considered as solution. So, the required inequality represented by the graph is
-2 ≥ x
Interval notation :
[-2, ∞)
Problem 3 :
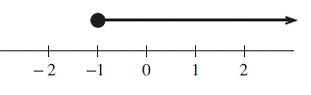
Solution :
At the top of -1, we have a solid circle. So, we are allowed to use ≤ or ≥ sign.
What are the solutions ?
All values which are greater than -1 can be considered as solution. So, the required inequality represented by the graph is
-1 ≥ x
Interval notation :
[-1, ∞)
Problem 4 :
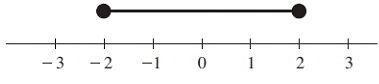
Solution :
At the top of -2 and 2, we have a solid circles. So, we are allowed to use ≤ or ≥ sign.
What are the solutions ?
All values which lies between -2 and 2 can be considered as solution. So, the required inequality represented by the graph is
-2 ≤ x ≤ 2
Interval notation :
[-2, 2]
Problem 5 :
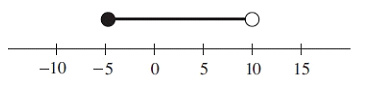
Solution :
At the top of -5, we have solid circle. At the top of 10, we have empty circle.
What are the solutions ?
All values which lies between -5 and 10 can be considered as solution. -5 is also included. So, the required inequality represented by the graph is
-5 ≤ x < 10
Interval notation :
[-5, 10]
Problem 6 :
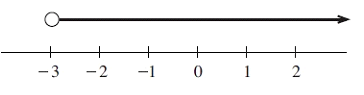
Solution :
At the top of -3, we have empty circle. At the top of -3, we have empty circle.
What are the solutions ?
All values which which are greater than -3 can be considered as solution. -5 is also excluded. So, the required inequality represented by the graph is
-3 < x < ∞
Interval notation :
(-3, ∞)
Problem 7 :
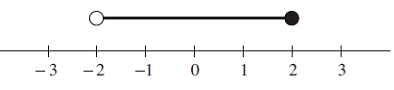
Solution :
At the top of -2, we have empty circle. At the top of 2, we have solid circle.
What are the solutions ?
All values which which are greater than -2 and lesser than 2 can be considered as solution.
-2 < x ≤ 2
Interval notation :
(-2, 2]
Problem 8 :
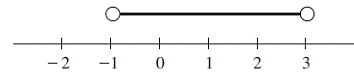
Solution :
At the top of -1 and 3, we have empty circle.
What are the solutions ?
All values which which are greater than -1 and lesser than 3 can be considered as solution.
-1 < x < 3
Interval notation :
(-1, 3)
Problem 9 :
Solution :
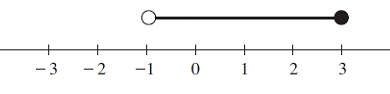
At the top of -1, we have empty circle. At the top of 3, we have solid circle.
What are the solutions ?
All values which which are greater than -1 and lesser than 3 can be considered as solution. 3 is included and -1 is excluded.
-1 < x ≤ 3
Interval notation :
(-1, 3]
Problem 10 :
Solution :
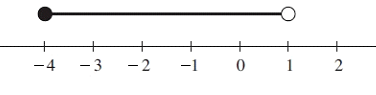
At the top of -4, we have solid circle. At the top of 1, we have empty circle.
What are the solutions ?
All values which which are greater than -4 and lesser than 1 can be considered as solution.
-4 ≤ x < 1
Interval notation :
[-4, 1)
Subscribe to our ▶️ YouTube channel 🔴 for the latest videos, updates, and tips.
Recent Articles
-
Finding Range of Values Inequality Problems
May 21, 24 08:51 PM
Finding Range of Values Inequality Problems -
Solving Two Step Inequality Word Problems
May 21, 24 08:51 AM
Solving Two Step Inequality Word Problems -
Exponential Function Context and Data Modeling
May 20, 24 10:45 PM
Exponential Function Context and Data Modeling