WRITE A SYSTEM OF INEQUALITIES FOR THE SHADED REGION
Problem 1 :
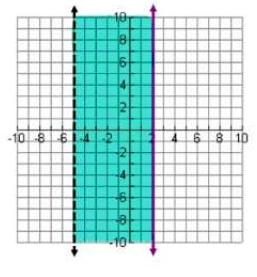
Write the system of 2 linear inequalities graphed below.

Solution:
In the above graph, we find the dotted line. So, we have to use the sign < or >.
Now, we have to look into the shaded portion. Since the shaded region is in right hand side from the dotted line, we have to use the sign ">".
x > -5
In the above graph, we find the solid line. So, we have to use the sign ≤ or ≥.
Now, we have to look into the shaded portion. Since the shaded region is in left hand side from the solid line, we have to use the sign "≤ ".
x ≤ 2
Problem 2 :
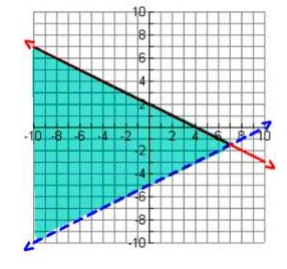
Write the system of 2 linear inequalities graphed below.

Solution:
1)
From the above graph, first let us find the slope and y-intercept.
Rise = -2 and Run = 4
Slope = -2/4 = -1/2
y-intercept = 2
So, the equation of the given line is
y = -1/2x + 2
But we need to use inequality which satisfies the shaded region.
Since the graph contains solid line, we have to use one of the signs ≤ or ≥.
y = -1/2x + 2
Take the point (1, 1) and apply it in the equation.
1 = -1/2(1) + 2
1 = -1/2 + 2
1 = 3/2
1 = 1.5
Here 1 is less than 1.5, so we have to choose the sign ≤ instead of equal sign in the equation y = -1/2x + 2.
Hence, the required inequality is
y ≤ -1/2x + 2
2)
Rise = 5 and Run = 10
Slope = 5/10 = 1/2
y-intercept = -5
Since the graph contains dotted line, we have to use one of the signs < or >. Shaded region is above, we have to use ">".
y > 1/2x - 5
Problem 3 :
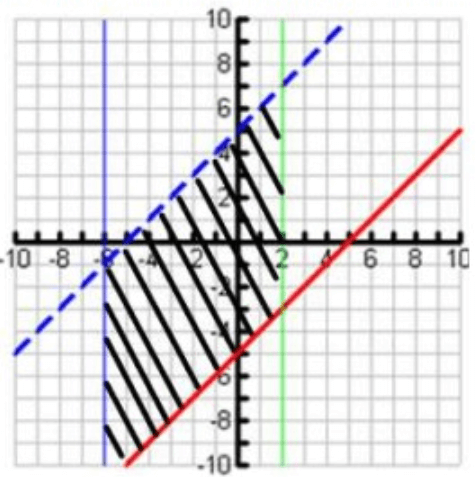
Write the system of 4 linear inequalities graphed below.

Solution:
1) Observing the graph from left to right,
Vertical Line (blue) :
In the above graph, we find the solid line. So, we have to use the sign ≤ or ≥.
Now, we have to look into the shaded portion. Since the shaded region is in right side from the solid line, we have to use the sign " ≥".
x ≥ -6
2) Dotted line (blue) :
Rise = 5 and Run = 5
Slope = 5/5 = 1
y-intercept = 5
Since the graph contains dotted line, we have to use one of the signs < or >. Shaded region is below, we have to use "<".
y < x + 5
3) Solid line (Red) :
Rise = 5 and Run = 5
Slope = 5/5 = 1
y-intercept = -5
Since the graph contains solid line, we have to use one of the signs ≤ or ≥. Shaded region is above, we have to use "≥".
y ≥ x - 5
4) Solid line (green) :
In the above graph, we find the solid line. So, we have to use the sign ≤ or ≥.
Now, we have to look into the shaded portion. Since the shaded region is in left hand side from the solid line, we have to use the sign "≤ ".
x ≤ 2
Recent Articles
-
Finding Range of Values Inequality Problems
May 21, 24 08:51 PM
Finding Range of Values Inequality Problems -
Solving Two Step Inequality Word Problems
May 21, 24 08:51 AM
Solving Two Step Inequality Word Problems -
Exponential Function Context and Data Modeling
May 20, 24 10:45 PM
Exponential Function Context and Data Modeling