SCATTER PLOTS AND LINES OF BEST FIT
Problem 1 :
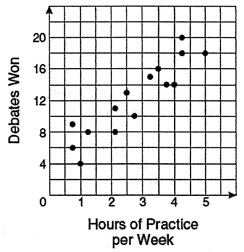
The scatter plot below indicates which of the following.
a) positive correlation b) negative correlation
c) no correlation d) a parallel correlation
Problem 2 :
Based on these results, if a team practice 4 hours per week next season, which is the best estimate of the number of debates the team can expect to win ?
a) 20 b) 12 c) 16 d) 1
Problem 3 :
Which of the following describes the correlation between gas that remained and the hours that he had passed ?
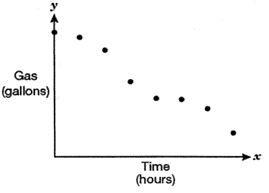
a) positive correlation b) negative correlation
c) no correlation d) undefined correlation
Problem 4 :
The following data table and scatter plot represent the number of negative customer reviews for a given model of cell phone and the total number of that same cell phone model were sold.
|
Number of negative reviews 125 98 50 106 21 69 80 37 |
Number of cell phones sold(in thousands) 163 505 701 355 925 592 700 890 |
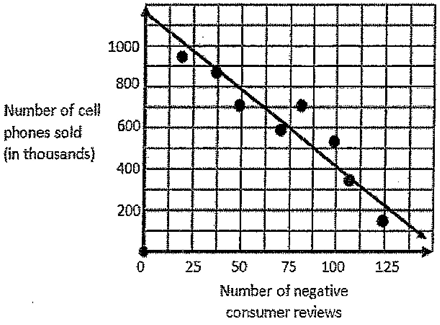
a) Points (37, 890) and (98, 505) are on the the line of best fit.
b) The scatter plot represents a negative correlation.
c) Its reasonable to predict that if there are 75 negative reviews the number of cell phones sold that same model will be close to 600,000.
Problem 5 :
A keyboard instructor at a community college collected data comparing a student's age and their typing speed. The equation for the line of best fit is given as
y = -1.4x + 117.8
where x is the age in years and y is the typing speed.
If you are 25 years of age, what is your typing speed ?
a) 153 words per minute b) 83 words per minute
c) 63 words per minute d) 102 words per minute
Problem 6 :
Below is the number of clothes denoted to New York City homeless shelters in the given years.
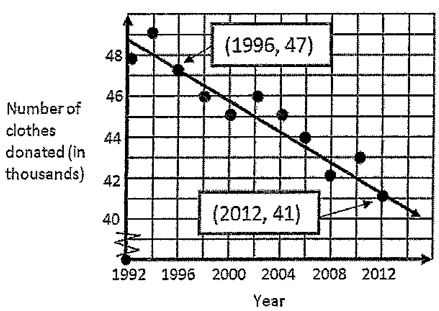
a) Determine the equation of line of best fit using the given two points on the line of best fit, where x is the number years since 1992 and y is the number of clothes denoted in thousands.
b) Using the equation for the line of best fit predict the year in which only 38000 items of clothing will be denoted to the homeless shelters in New York City.
Problem 7 :
At the Happy Paper Company the more boxes of paper you order the cheaper the price you have to pay of each box of paper. Below are the prices charged per box of paper to different companies ordering various quantities of paper.
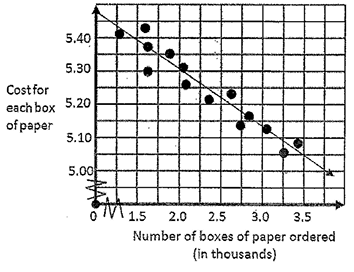
Using the line of best fit, if your company wants to only pay $5.05 for each box of paper, how many boxes of paper should be ordered from Happy Paper Company ?
Problem 8 :
A base ball coach graphs some data and finds the line of best fit. The equation for the line of best fit is
y = 0.32x - 20.51
where x is the number of times at bat and y is the number of hits.
How many hits should he expect from a player who is at bat 175 times ?
a) 35 hits b) 49 hits c) 609 hits
d) 62 hits
Answer Key
1) positive correlation.
2) 16 will be the best estimation.
3) negative correlation.
4) a) False b) True c) True
5) 83 words per minute
6) a) y = -0.375 x + 48.5
b) About 28 years.
7) About 3500 boxes.
8) 35 hits
Recent Articles
-
Finding Range of Values Inequality Problems
May 21, 24 08:51 PM
Finding Range of Values Inequality Problems -
Solving Two Step Inequality Word Problems
May 21, 24 08:51 AM
Solving Two Step Inequality Word Problems -
Exponential Function Context and Data Modeling
May 20, 24 10:45 PM
Exponential Function Context and Data Modeling