WORKSHEET OF LINE OF BEST FIT FOR SAT
Problem 1 :
Male crickets vary their chirp rate according to the temperature. The scatter plot below shows the relationship between chrip and temperature for 9 crickets. The line of best fit is also shown.
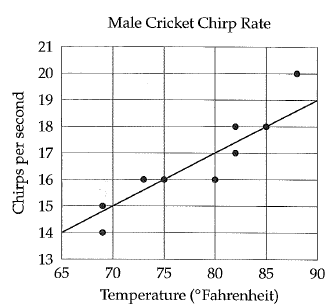
1) Based on the line of best fit, what is the predicted male cricket chrip rate at the temperature of 80 degrees Fahrenheit ?
2) What is the chrip rate of the male cricket represented by the data point that is farthest from the line of best fit ?
Problem 2 :
The scatter plot below shows the relationship between apartment price and size for 13 apartments. The line of best fit is also shown.
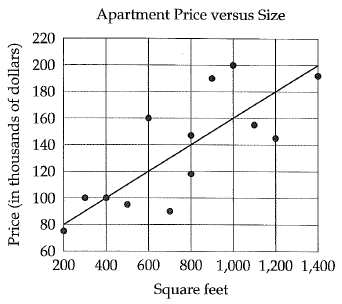
1) According to the line of best fit, which of the following best approximates the size in square feet of the apartment for which price is estimated to be 180 thousand dollars ?
a) 600 b) 800 c) 1000 d) 1200
2) For the 600 square foot apartment, the actual price is how many dollars more than the price predicted by the line of best fit ?
a) 20,000 b) 30,000 c) 40,000 d) 50,000
Problem 3 :
The average speed of serve and number of years training were recorded for 20 tennis players and plotted in the grid above. Which of the following statements is supported by the plotted data ?
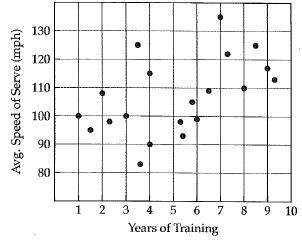
A) The player with the least number of years of training had the slowest serve.
B) The player with the highest number of years of training had the fastest serve.
C) More than half of the players had a serve exceeding 110 miles per hour.
D) More than half of the players had more than 5 years of training.
Problem 4 :
The scatter plot above shows the relationship between horsepower and fuel efficiency for 15 years. The line of best is also shown.
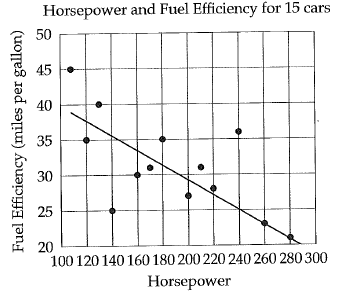
Which of the following is the best interpretation of the meaning of slope of the line of best fit ?
A) The predicted increase in a car's horse power for every mile per gallon decrease in fuel efficiency.
B) The predicted decrease in a car's horsepower for every mile per gallon decrease in fuel efficiency.
C) The predicted mile per gallon increase in car's fuel efficiency for every decrease of one horse power.
D) The predicted mile per gallon decrease in a car's fuel efficiency for every decrease of one horsepower.
Problem 5 :
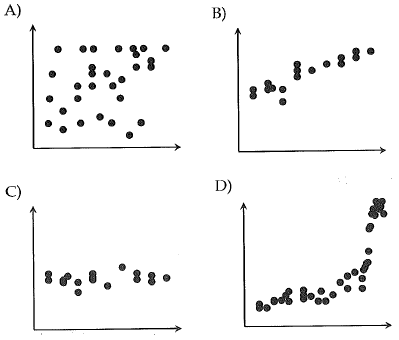
Which scatter plot shows a positive association that is not linear.
Problem 6 :
The scatter plot below shows the weekly number of requests received at 7 different government agencies and their processing time per request. The line of best fit is also shown.
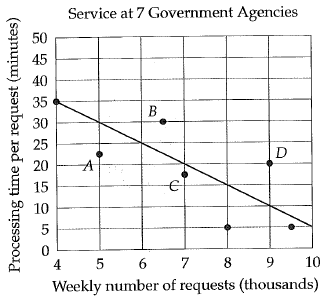
1) How many of the 7 government agencies have a processing time per request that differs by more than 5 minutes from the predicted by the line of best fit ?
A) 3 B) 4 C) 5 D) 6
2) Of the labeled points, which represents the government agency that spends the most time processing all of its request each week ?
A) A B) B C) C D) D
Problem 7 :
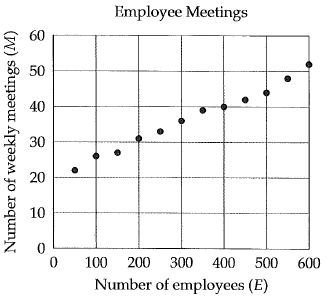
The scatterplot above shows the number of employees E and the number of weekly meetings M at 7 companies selected at random. Which of the following equations best models the relationship between E and M ?
A) M = 0.05 E + 20 B) M = 0.1E + 16
C) M = 0.5E + 18 D) M = 5 E + 25
Problem 8 :
The scatter plot below shows the relationship between the speed of the driver and the amount of the fine, in dollars, for 15 spending tickets issued a local police department. The line of best fit is also shown.
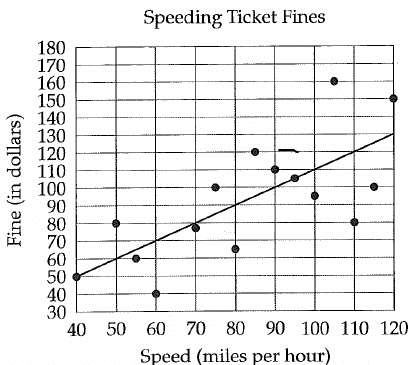
1) Based on the line of best fit, what is the predicted fine in dollars for a driver spending at 90 miles per hour ?
A) 70 B) 80 C) 90 D) 100
2) Which of the following the best interpretation of the slope of the line of best fit in the context of this problem ?
A) The estimated find increase, in dollars for every mile per hour over the speed limit.
B) The estimated fine increase, in dollars for every 10 miles per hour over the speed limit.
C) The estimated increase in the speed of the driver in miles per hour, for every one dollar increase in the fine.
D) The estimated increase in the speed of the driver, in miles per hour, for every 10 dollar increase in the fine.
Recent Articles
-
Finding Range of Values Inequality Problems
May 21, 24 08:51 PM
Finding Range of Values Inequality Problems -
Solving Two Step Inequality Word Problems
May 21, 24 08:51 AM
Solving Two Step Inequality Word Problems -
Exponential Function Context and Data Modeling
May 20, 24 10:45 PM
Exponential Function Context and Data Modeling