USING STEM AND LEAF PLOT WORKSHEET
Subscribe to our ▶️ YouTube channel 🔴 for the latest videos, updates, and tips.
Problem 1 :
The list below shoes the number of points scored by each player on the baseball team during the season. Use a stem-and-leaf plot to represent the data.
19, 15, 40, 41, 22, 10, 37, 26, 41, 37, 12, 5, 41, 39, 16
Problem 2 :
The stem-and-leaf plot shows the scores of ice skaters at a qualifying competition. The score to qualify for the next level of the competition is 8.5 or higher.
How many skaters qualify for the next level of the competition?

Problem 3 :
The stem-and-leaf plot represents a set the individual sales data for a local scout troop selling cookies. What is the difference between the greatest number of cookies sold and the least number of cookies sold?

What was the largest quantity of cookie boxes sold by a scout?
What was the least quantity of cookie boxes sold by a scout?
Problem 4 :
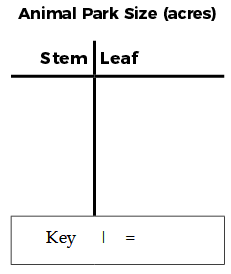
The set of data shows the size of several animal parks in the United States in acres.
58, 85, 95, 80, 55, 80, 64, 90, 75, 92
Represent the data using a stem-and-leaf plot. Be sure to include a key for the plot.
Problem 5 :
When making a stem and leaf plot to organize a set of numbers such as
25.1, 26.3, 28.4, 24.4, 23.6, 25.4,
and so on, how should the key appear?
Problem 6 :
The stem-and-leaf plot represents a runner's time data, in seconds, while training for a track event.
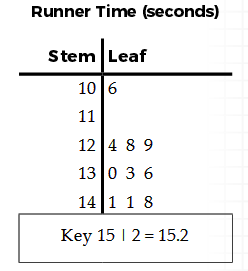
How many times did the runner finish the distance with a time faster then 13 seconds?
Problem 7 :
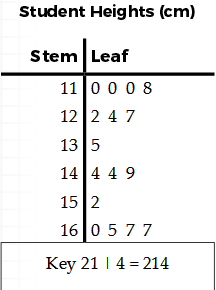
The stem-and-leaf-plot shows the heights in centimeters of the students in Mr. Martin's homeroom. What is the difference between the highest and lowest value in the data set? Record your answer and fill in the bubbles. Be sure to use the correct value.
Problem 8 :
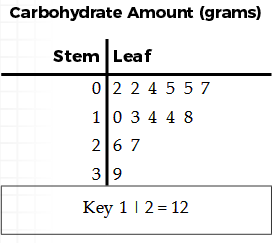
The stem-and-leaf plot shows the grams of net carbohydrates found in the food items Nancy ate today. What fraction of the food items Nancy ate have more than 10 grams of net carbohydrates?
Problem 9 :
Miguel picked up a small jar of screws in the garage and started to sort them by length in inches. The stem-and-leaf plot shows the lengths of all the screws in the jar.
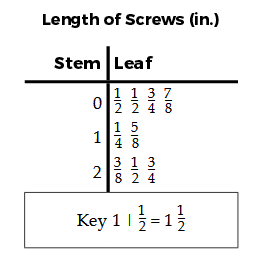
If Miguel lined all the screws from end to end, what would be the total length?
Problem 10 :
The stem-and-leaf plot shows the daily high temperature values for a 3-week period.
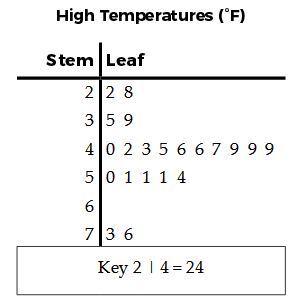
How many more days was the temperature above 45° than it was 45° or below?
A. 2 B. 8 C. 5 D. 13
Problem 11 :
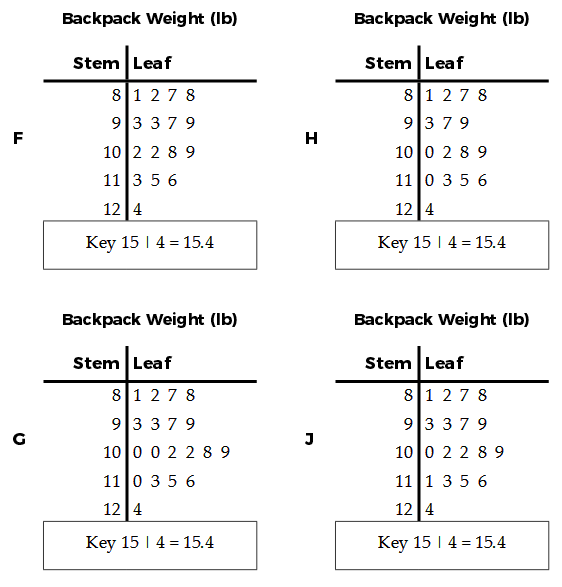
Researchers weighed student backpacks. The weights of some of the backpacks are listed below. Weights are listed in pounds.
9.3, 8.1, 10, 11.3, 10.2, 8.2, 11.5, 10.9, 8.7, 10.8, 8.8, 12.4 9.3, 9.7, 11, 9.9, 10, 10.2, 11.6
Which stem-and-leaf plot best represents the data?
Subscribe to our ▶️ YouTube channel 🔴 for the latest videos, updates, and tips.
Recent Articles
-
Finding Range of Values Inequality Problems
May 21, 24 08:51 PM
Finding Range of Values Inequality Problems -
Solving Two Step Inequality Word Problems
May 21, 24 08:51 AM
Solving Two Step Inequality Word Problems -
Exponential Function Context and Data Modeling
May 20, 24 10:45 PM
Exponential Function Context and Data Modeling