USING GRADIENT TO SOLVE WORD PROBLEMS
Problem 1 :
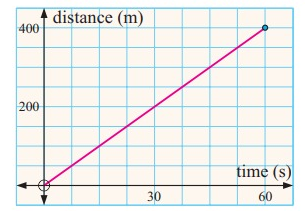
The graph alongside indicates the distance run by a sprinter in a number of seconds.
a. Find the gradient of the line.
b. Interpret the gradient found in a.
c. Is the speed of the runner constant or variable? What evidence do you have for your answer?
Solution:
a.
Points (x1, y1) = (30, 200) and (x2, y2) = (60, 400)
b. The graph indicates that for ever second, he will cover the distance of 6 2/3 m
c.
From the above graph, it can be concluded that the speed of the runner is constant. Since, the distance covered by the runner has been constant across time.
Speed is constant as gradient is constant.
Problem 2 :
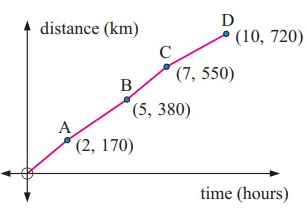
The graph alongside indicates the distances travelled by a truck driver. Determine:
a. the average speed for the whole trip
b. the average speed from
i. O to A ii. B to C
c. the time interval over which the average speed is greatest.
Solution:
b.
i. O to A
ii. B to C
c.
we already know, O to A and B to C, so we need
O to A (0 - 2 hours) and B to C (5 - 7 hours) are the greatest time intervals.
Problem 3 :
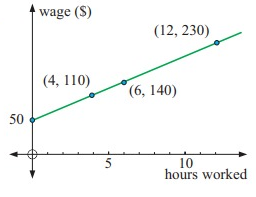
The graph alongside indicates the wages paid to sales assistants.
a. What does the intercept on the vertical axis mean?
b. Find the gradient of the line. What does this gradient mean?
c. Determine the wages for working:
i. 6 hours ii. 18 hours
d. If no payment was made for not working but the same payment was made for 8 hours work, what would be the new rate of pay?
Solution:
a.
y-intercept represents, for sales assistants they are paying $50 initially.
b.
Gradient is 15, which means the slope is positive and wages are higher as the number of hours worked.
c.
i) 6 hours:
W know, the wages for working 6 hours is $140.
ii) 18 hours:
0 - 6 hours and 6 - 12 hours
From the (1) and (2), we can determine the wages increase by $90 every 6 hours.
Hence, 18 hours is 230 + 90 = $320.
d. No payment means, wages = 0, number of hours working = 0
Number of hours working = wage per hour = 8
(0, 0) and (8, 8).
Slope = (8 - 0)/(8 - 0)
= 1
Then, the new rate of pay is 1.
Problem 4 :
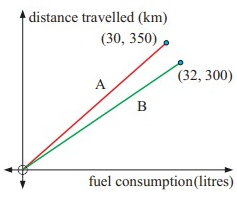
The graphs alongside indicate the fuel consumption and distance travelled at speeds of 60 kmph (graph A) and 90 kmph (graph B).
a. Find the slope of each line.
b. What do these slopes mean?
Solution:
a.
Slope of A:
Slope of B:
b. The consumption of fuel per km.
Problem 5 :
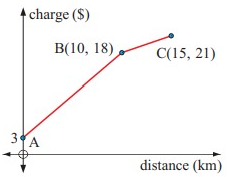
The graph alongside indicates the courier charge for distance travelled.
a. What does the value at A indicate?
b. Find the gradients of the line segments AB and BC. What do these gradients indicate?
c. If a straight line segment was drawn from A to C, find its gradient. What would this gradient mean?
Solution:
A is the position of y-intercept, booking charge of courier service is $3.
Recent Articles
-
Finding Range of Values Inequality Problems
May 21, 24 08:51 PM
Finding Range of Values Inequality Problems -
Solving Two Step Inequality Word Problems
May 21, 24 08:51 AM
Solving Two Step Inequality Word Problems -
Exponential Function Context and Data Modeling
May 20, 24 10:45 PM
Exponential Function Context and Data Modeling