UNIMODAL BIMODAL SYMMTERIC DISTRIBUTION OF DOT PLOTS
Subscribe to our ▶️ YouTube channel 🔴 for the latest videos, updates, and tips.
In any dot plot, look for the overall pattern and striking departures from the pattern.
Shape :
- Concentrate with main features.
- Look for clusters and obvious gaps.
- Look for potential outliers.
- Look for rough symmetry or skewness.
- Look for the number of modes or peaks.
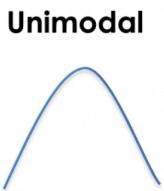
Unimodal :
Describes a graph of quantitative data with single peak.
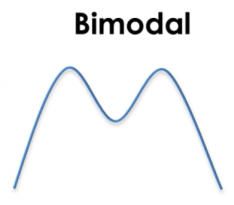
Bimodal :
Describes a graph of quantitative data with two clear peaks.
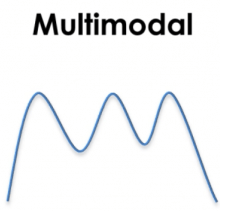
Multimodal :
Describes a graph of quantitative data with more than two clear peaks.
Symmetric :
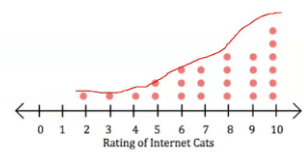
A distribution is roughly symmetric if the right and left sides of the graph are approximately the same.
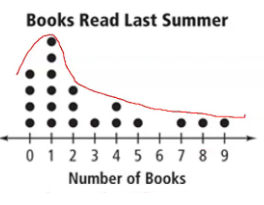
Skewed right :
A distribution is skewed to the right if the right side of the graph is much longer than the left side.
Skewed left :
A distribution is skewed to the left if the left side of the graph is much longer than the right side.
Note :
The direction of the long tail gives the direction of skewness.
Center :
Find the values that divides the observation in half. We will use the mean and median to do this.
Spread :
The spread of the distribution tells us how much variability there is in the data.
To find the spread, describe the smallest and largest values. Also use the range (maximum - minimum)
Subscribe to our ▶️ YouTube channel 🔴 for the latest videos, updates, and tips.
Problem 1 :
Martha conducted a random survey during lunch. She asked 20 students and 20 teachers how many siblings they have. The survey data are represented in the dot plots below
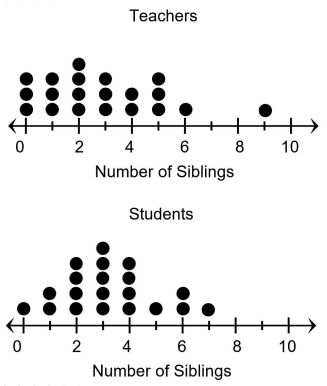
Based on the data in the dot plots, fill in the blanks to create a true statement.
1. The range of the data for the survey results for teachers is _________ than the range of the data for the survey results for the students.
2. The mode of the data for the survey results for teachers is _________ than the mode of the data for the survey results for the students.
3. The data for the survey for _________ is more symmetrical than the data for the survey for _________.
4. The median of the data for the survey results for teachers is _________ than the median of the data for the survey results for the students.
5. The greatest number of siblings for teachers is _________ than the greatest number of siblings for students.
Solution :
1)
For teachers :
Greatest value = 9, least value = 0
Range = 9 - 0 ==> 9
For students :
Greatest value = 7, least value = 0
Range = 7 - 0 ==> 7
The range of the data for the survey results for teachers is greater than the range of the data for the survey results for the students.
2) Mode for teacher = 2
Mode for students = 3
The mode of the data for the survey results for teachers is lesser than the mode of the data for the survey results for the students.
3)
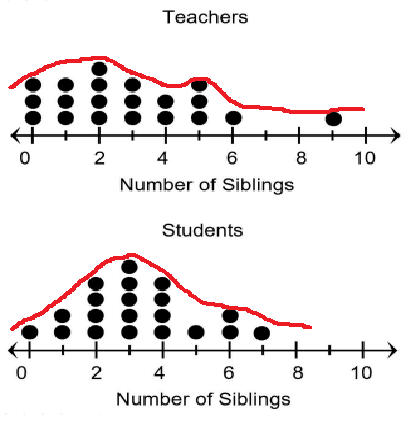
The data for the survey for students is more symmetrical than the data for the survey for teachers.
4) 20 values are in the data set.
Average of 10th term and 11th term will be median.
= (2 + 3)/2
= 2.5
Median of number of sibling of teacher is 2.5.
Median of number of sibling of students is 3.
The median of the data for the survey results for teachers is lesser than the median of the data for the survey results for the students.
5) greatest number of sibling of teacher = 9
Greatest number of siblings for students = 7
The greatest number of siblings for teachers is greater than the greatest number of siblings for students.
Problem 2 :
Use the following information for questions. Determine if each statement is true or false
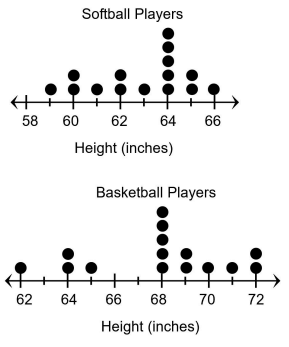
1) The range of the data for the heights of softball players is less than the range of the data for the heights of basketball players.
2) The median of the data for the heights of softball players is greater than the median of the data for the heights of basketball players.
Solution :
|
Soft ball players Range = 66 - 59 = 7 Number of data = 15 median = 8th value = 64 |
Basket ball players Range = 72 - 62 = 10 Number of data = 15 median = 8th value = 68 |
1) true.
2) False.
Problem 3 :
Mrs. Khan took a survey in her first and second period classes concerning the number of books that students read last summer.
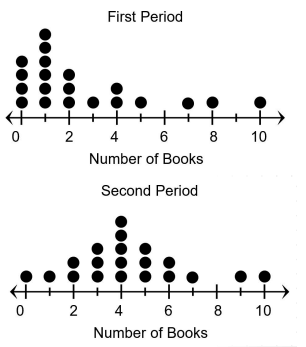
Which statement is supported by the information in the dot plots?
A) The data for 1st period and the data for 2nd period are skewed to the right?
B) The median number of books read last summer in 1st period is greater than the median number of books read last summer in 2nd period.
C) The range of the number of books read last summer in 1st period is equal to the range of the number of books read last summer in 2nd period.
D) The mode number of books read last summer in 2nd period is less than the mode number of books read last summer in 1st period.
Solution :
By observing the dot plot, the data for first period is skewed right. The data for the second period is symmetric.
Median of 1st period = 1, median of 2nd period = 4
Range of 1st period = 10 - 0 ==> 10
Range of 2nd period = 10 - 0 ==> 10
So, option C is correct.
Problem 4 :
The dot plots below represent two sets of data.
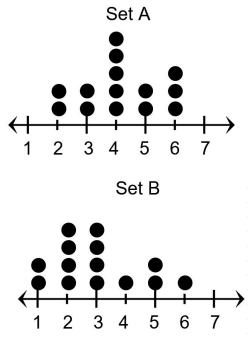
Here are three statements about the data.
I. The mode of the data in Set A is equal to the mode of the data in Set B.
II. The range of the data in Set A is less than the range of the data in Set B.
III. The median of the data in Set A is greater than the median of the data in Set B.
Which of these three statements appear to be true?
A) I only B) I and II C) II and III D) III only
Solution :
|
Set A Mode = 4 Range = 6-2 ==> 4 Median = 4 |
Set B Mode = 2 and 3 Range = 6-1 ==> 5 Median = 3 |
So, II and III is true. Option C.
Recent Articles
-
Finding Range of Values Inequality Problems
May 21, 24 08:51 PM
Finding Range of Values Inequality Problems -
Solving Two Step Inequality Word Problems
May 21, 24 08:51 AM
Solving Two Step Inequality Word Problems -
Exponential Function Context and Data Modeling
May 20, 24 10:45 PM
Exponential Function Context and Data Modeling