SHAPES OF BOX AND WHISKER PLOTS
Subscribe to our ▶️ YouTube channel 🔴 for the latest videos, updates, and tips.
A box and whisker plot shows the variability of a data set along a number line using the least value, the greatest value and quartiles of the data.
Skewed Left

- The left whisker is longer than the right whisker.
- Most of the data are on the right side of the plot.
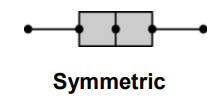
Symmetric

- The whiskers are about the same length.
- The median is in the middle of the plot.
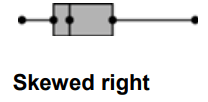
Skewed Right

- The right whisker is longer than the left whisker.
- Most of the data are on the left side of the plot.
Problem 1 :
The box-and-whisker plot represents the prices (in dollars) of soccer balls at different sporting goods stores.

a. Find and interpret the range of the data.
b. Describe the distribution of the data.
c. Find and interpret the interquartile range of the data.
d. Are the data more spread out below Q1 or above Q3? Explain.
Solution :
a) Range = maximum value - minimum value
= 24.5 - 8.5
Range = 16
b) Observing the figure, the distribution is symmetric.
c) Interquartile range = Q3 - Q1
Q1 = 11.25, Q3 = 20.25
IQR = 20.25 - 11.25
IQR = 9
d) Above Q3, because it is greater value.
Problem 2 :
The double box-and-whisker plot represents the number of tornados per month for a year for two states.

a. Identify the shape of each distribution.
b. Which state’s number of tornadoes are more spread out?
c. Which state had the single least number of tornadoes in a month during the year?
Solution :
a) Shape of State A = Symmetric
Shape of State B = Skewed right
b) In State B, number of tornadoes are more spread out.
c) State A has least number of tornadoes over a year.
Problem 3 :
a) The interquartile range of a data is the _________ of the _______ quartile and the ________ quartile.
b) In a box and whisker plot, the entire box represents about _______ % of the data.
c) In a box and whisker plot, one whisker represents about _____ % of the data.
Solution :
a) The interquartile range of a data is the difference of the upper quartile and the lower quartile.
b) In a box and whisker plot, the entire box represents about 50% of the data.
c) In a box and whisker plot, one whisker represents about 25 % of the data.
Problem 4 :
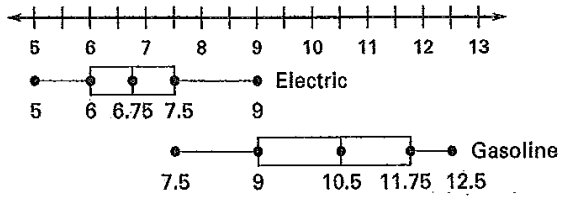
The box and whisker plots show the weights of electric handheld power blowers and gasoline handheld power blowers.

a) Compare the median, range and interquartile range for the two types of blowers.
b) About what percent of the electric blowers are less than 7.5 pounds ? About what percent of gasoline blowers are more than 10.5 pounds ?
Solution :
a)
|
Median Range IQR |
Electric 6.75 7.5 - 5 = 2.5 7.5 - 6 = 1.5 |
Gasoline 10.5 12.5 - 7.5 = 5 11.75 - 9 = 2.75 |
b) About 75% of the electric blowers are less than 7.5 pounds.
About (25 + 25) = 50% of the gasoline blowers are more than 10.5 pounds.
Subscribe to our ▶️ YouTube channel 🔴 for the latest videos, updates, and tips.
Recent Articles
-
Finding Range of Values Inequality Problems
May 21, 24 08:51 PM
Finding Range of Values Inequality Problems -
Solving Two Step Inequality Word Problems
May 21, 24 08:51 AM
Solving Two Step Inequality Word Problems -
Exponential Function Context and Data Modeling
May 20, 24 10:45 PM
Exponential Function Context and Data Modeling