SEVENTH GRADE STAAR TEST MATH
Problem 31 :
The box plots summarize the number of semester hours students enrolled in a university and a community college completed during the fall semester.

Which statement is best supported by the data in the box plots?
A. The median of the data for the university is greater than the median of the data for the community college.
B. The range of the data for the university is greater than the range of the data for the community college.
C. The interquartile range of the data for the community college is greater than the interquartile range of the data for the university.
D. The third quartile of the data for the community college is greater than the third quartile of the data for the university
Solution:
The interquartile range of the data for the community college is greater than the interquartile range of the data for the university.
15 - 6 = 9 > 6
So, option (C) is correct.
Problem 32 :
Alice has a loan of $24,820. This loan has a simple interest rate of 3.5% per year. No payments will be made on the loan until the end of one year.
How much interest will Alice pay on this loan at the end of one year?
A. $868.70 B. $72.39 C. $8,687.00 D. $25,688.70
Solution:
Given, principal (P) = $24,820
Rate of interest (R) = 3.5% = 0.035
Time (T) = 1 year
Simple interest = P × R × T
= 24820 × 0.035 × 1
Simple interest = $868.7
Therefore, he will be paid the amount of $868.7 interest in the loan at the end of one year.
So, option (A) is correct.
Problem 33 :
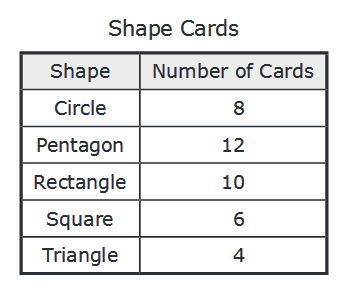
A student has a set of cards. Each card has a picture of one shape. The table shows the number of cards that have a picture of each shape. The student will randomly select one card from the set.

Which statement is true?
A. The probability of selecting a card with a picture of a circle is 5/8, and the probability of selecting a card that is not a picture of a circle is 3/8.
B. The probability of selecting a card with a picture of a circle is 3/8, and the probability of selecting a card that is not a picture of a circle is 5/8.
C. The probability of selecting a card with a picture of a circle is 1/5, and the probability of selecting a card that is not a picture of a circle is 4/5.
D. The probability of selecting a card with a picture of a circle is 4/5, and the probability of selecting a card that is not a picture of a circle is 1/5.
Solution:
Total number of cards = 8 + 12 + 10 + 6 + 4 = 40
Probability of selecting a card that is not circle = 1 - Probability of selecting circle
So, the probability of selecting a card with a picture of a circle is 1/5, and the probability of selecting a card that is not a picture of a circle is 4/5.
So, option (C) is correct.
Problem 34 :
The model represents an equation.

What is the solution for the equation?
Solution:
So, option (B) is correct.
Problem 35 :
A survey showed that 8 out of 20 homeowners in a neighborhood had cable television. If there were 320 homeowners in the neighborhood, how many could be expected to have cable television?
Solution:
Number of homeowners could be expected to have cable television:
Problem 36 :
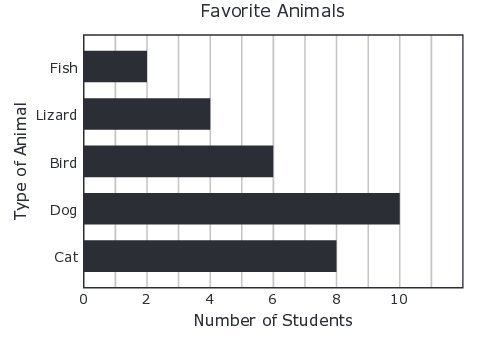
Students were surveyed to determine their favorite types of animals. The bar graph shows the number of students who selected each type of animal.

What percentage of the students surveyed selected “Bird” as their favorite type of animal?
A. 20% B. 5% C. 6% D. 80%
Solution:
Total number of students = 2 + 4 + 6 + 8 +10
= 30
Percentage of students surveyed for Bird = 6
So, option (A) is correct.
Problem 37 :
A principal has given a class $75 to help pay for a field trip to a zoo. The students in the class are selling pies for $5 each to earn the rest of the money they need. The field trip will cost a total of $386.
Which inequality can be used to find p, the number of pies the class needs to sell in order to earn enough money to pay for the field trip?
A. 5p + 75 ≤ 386 B. 5p + 75 ≥ 386
C. 75p + 5 ≥ 386 D. 75p + 5 ≤ 386
Solution:
Given, Principal = $75
Total cost of trip = $386
Price of a pie = $5
5p + 75 ≥ 386
So, option (B) is correct.
Problem 38 :
The dimensions of a rectangular prism are 1.5 feet by 3.5 feet by 2 feet. What is the volume of the rectangular prism in cubic feet?
A. 7 ft3 B. 7.25 ft3 C. 8.5 ft3 D. 10.5 ft3
Solution:
The volume of rectangular prism = length × width × height
V = 1.5 ft × 3.5 ft × 2 ft
V = 10.5 ft3
So, option (D) is correct.
Problem 39 :
The circumference of a circle is C inches. The diameter of the circle is 19 inches. Which expression best represents the value of π?
Solution:
Given, diameter = 19 inches
radius = 19/2 inches
Circumference of circle = 2πr
So, option (A) is correct.
Problem 40 :
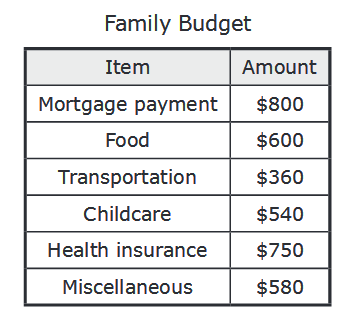
A monthly budget for a small family is shown.

Which equation can be used to find b, the minimum amount of money the family must earn annually in order to meet this budget?
A. b = $3,630 × 12
B. b = $3,630 × 52
C. b = $43,560 ÷ 52
D. b = $43,560 ÷ 365
Solution:
Total amount = 800 + 600 + 360 + 540 + 750 + 580
= $3630
b = $3630 × 12
This equation to find the minimum amount of money the family must earn annually in order to meet this budget.
So, option (A) is correct.
Recent Articles
-
Finding Range of Values Inequality Problems
May 21, 24 08:51 PM
Finding Range of Values Inequality Problems -
Solving Two Step Inequality Word Problems
May 21, 24 08:51 AM
Solving Two Step Inequality Word Problems -
Exponential Function Context and Data Modeling
May 20, 24 10:45 PM
Exponential Function Context and Data Modeling