SCATTER PLOTS AND LINE OF BEST FIT
Subscribe to our ▶️ YouTube channel 🔴 for the latest videos, updates, and tips.
Problem 1 :
The line of best fit for the profits of a 5-year-old company is shown below.
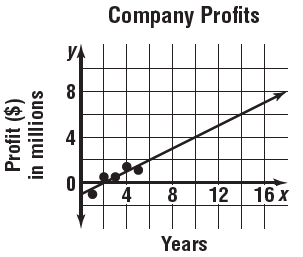
By the end of its eighth year, about how much profit should the company be making?
a) $3 million b) $5 million c) $7 million d) $18 million
Solution :
By observing the line of best fit, it is clear that at the end of 8 years the company is making the profit of 3 million.
Problem 2 :
The scatter plot below shows the height of a hot air balloon as it lifts off. A line of best fit for the data is also shown.
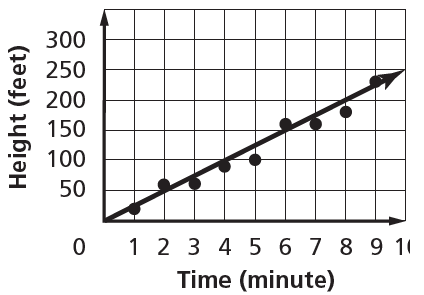
Which of the following linear equations represents the line of best fit for x > 0?
a) y = x + 25 b) y = 25x c) y = 2x + 25 d) y = 2x + 50
Solution :
Choosing two points closer to the line, (2, 52) and (6, 152)
Slope = (152 - 52) / (6 - 2)
= 100 / 4
= 25
y-intercept = 0
So, the required equation will be
y = 25x + 0
y = 25x
Problem 3 :
On the scatterplot below, the x-axis represents the latitude from the equator to the North Pole and the y-axis represents the average temperature.
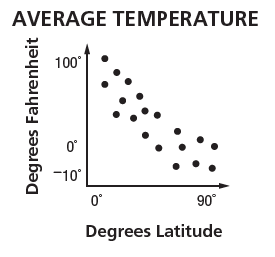
Which statement best describes the relationship between latitude and temperature?
a) As latitude increases, temperature increases.
b) Latitude and temperature are not related.
c) As latitude increases, temperature decreases.
d) As temperature changes, latitude remains constant.
Solution :
By observing the distribution of latitude increase, the temperature will also increase. So, option a is correct.
Problem 4 :
The graph below shows the monthly cost of a long-distance calling plan.
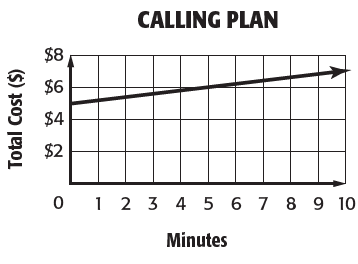
What does the slope of the graph represent?
a) the cost of zero minutes of calls
b) the cost per additional minutes of long-distance calls
c) the total cost of long-distance calls
d) the number of minutes $1 can buy
Solution :
The total cost of call will increase as minutes increasing. So, option b is correct.
Problem 5 :
The graph below shows the weight of a bucket as it is filled with sand.
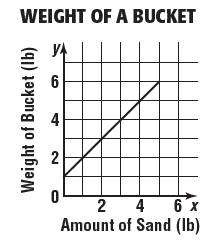
What is the weight of the empty bucket?
a) 0 pounds b) 1 pound c) 2 pounds d) 6 pounds
Solution :
From the graph, y-intercept represents the quantity of sand in the empty bucket.
So, 1 pound of sand is in the empty bucket.
Problem 6 :
The scatter plot below shows the relationship between a person’s height and the amount of time that person spends reading books.
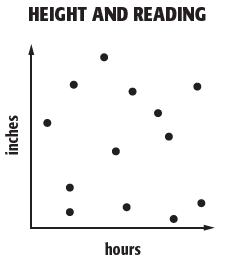
Which conclusion can be drawn from the scatter plot?
a) As a person’s height increases, the amount of time that person spends reading books increases.
b) A person’s height and the amount of time that person spends reading books are not related.
c) As a person’s height decreases, the amount of time that person spends reading books increases.
d) As a person’s height increases, the amount of time that person spends reading books decreases.
Solution :
A person’s height and the amount of time that person spends reading books are not related. So, option b is correct.
Problem 7 :
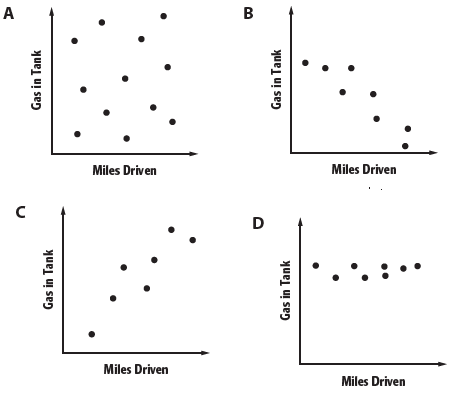
Which of the following scatter plots represents a negative correlation?
Solution :
By observing the spread from left to right, we can draw the falling line as line of best fit in option b.
Option a :
There is no relationship between miles driven and gas in tank.
Option b :
Negative correlation between miles driven and gas in tank.
Option c :
Positive correlation between miles driven and gas in tank.
So, option b is correct.
Problem 8 :
The scatter plot shows data points and a line of best fit for lemonade sales as a function of the outside temperature.
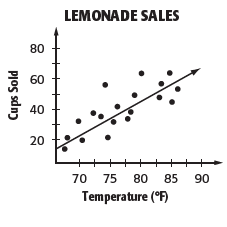
Which is the best prediction for the number of sales when the
temperature reaches 90°F?
a) 65 cups b) 80 cups c) 90 cups d) 110 cups
Solution :
By extending the line of best fit, when 90°F the cups sold is 65. So, option a is correct.
Problem 9 :
The line of best fit for the profits of a 5-year-old company is shown below.
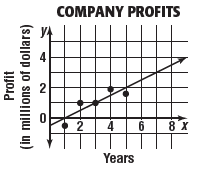
Which of the following equations appears to best represent the line?
a) y = x b) y = 3x + 2 c) y = (1/2)x - 1/2
d) y = (3/2)x - 1/2
Solution :
Slope = 1/2 and one of the points on the line is (3, 1).
y - y1 = m(x - x1)
y - 1 = (1/2)(x - 3)
2(y - 1) = 1(x - 3)
2y - 2 = x - 3
2y = x - 3 + 2
2y = x - 1
y = (1/2)x - 1/2
So, option c is correct.
Subscribe to our ▶️ YouTube channel 🔴 for the latest videos, updates, and tips.
Recent Articles
-
Finding Range of Values Inequality Problems
May 21, 24 08:51 PM
Finding Range of Values Inequality Problems -
Solving Two Step Inequality Word Problems
May 21, 24 08:51 AM
Solving Two Step Inequality Word Problems -
Exponential Function Context and Data Modeling
May 20, 24 10:45 PM
Exponential Function Context and Data Modeling