REVIEW ON STATISTICS AND PROBABILITY FOR GRADE 8 EOG
Problem 1 :
At a particular company, every employee receives a 4% cost of living increase to their salary.
What impact does this cost living increase have on the mean and range of employee salaries at the company.
A) The mean increases but the range does not change.
B) The mean does not change but the range increases.
C) The mean and range both increase.
D) The mean and range do not change.
Problem 2 :
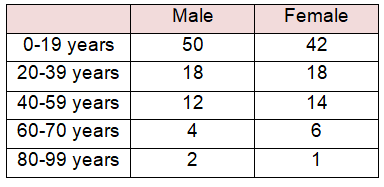
The frequency table below shows the age distribution of people at a park.

What is the probability a randomly selected person at a park is a female, given that the person is under 40 years old ?
A) 60/167 B) 15/32 C) 1/2 D) 60/81
Problem 3 :
Twenty one students at a school have an allergy to peanuts, shellfish or both.
- Fourteen students at a school are allergic to peanuts.
- Twelve students at the school are allergic to shellfish.
How many students are allergic to both peanuts and shellfish ?
A) 12 B) 7 C) 5 D) 2
Problem 4 :
There are 250 students in a senior class.
- Of the 250 students, 102 are boys.
- There are 20 senior girls and 18 senior boys on the track team
What is the probability a randomly chosen student from the senior class is a girl who does not run track ?
A) 0.920 B) 0.512 C) 0.497 D) 0.135
Problem 5 :
An elevator can hold a maximum of 1500 pounds. Eight people need to use the elevator. Bill had some measures from the data set how much each person weighed. Which measure would be most useful to determine if the people can safely use the elevator ?
A) Mean B) Median C) Mode
D) Interquartile range
Problem 6 :
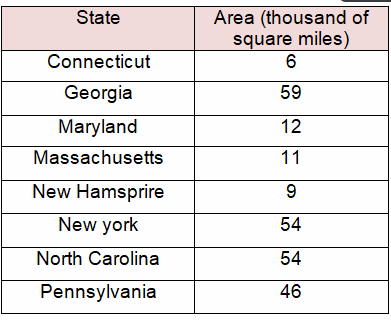
The table below shows the area of several states

Delaware has an area of 2000 square miles. Which is true if Delaware is included in the data set ?
A) The mean increases
B) The range decreases
C) The interquartile range decreases.
D) The standard deviation increases.
Problem 7 :
The number of points scored by the basketball player in the first eight games of a season are shown below.
15, 35, 18, 30, 25, 21, 32, 16
What would happen to the data distribution if she scored 24, 22, 27 and 28 points in her four games ?
A) The data distribution would become less peaked and more widely spread.
B) The data distribution would become less peaked and less widely spread.
C) The data distribution would become more peaked and less widely spread.
D) The data distribution would become more peaked and more widely spread.
Problem 8 :
A book club has 200 members. Each member was asked whether he or she prefers fiction or nonfiction books. The results are shown in the relative frequency table below.

Which statement is true ?
A) 6 more 31-40 years old than 21-30 years olds prefer fiction.
B) 38 members are 31-40 and prefer fiction.
C) 43 members are 21-30 years old.
D) 140 members prefer fiction.
Problem 9 :
A college surveyed 3500 of its students to determine if the students preferred music, movies or sports. The results of the survey are shown in the relative frequency table below.

How many seniors and juniors were included in the survey ?
A) 70 B) 105 C) 140 D) 175
Problem 10 :
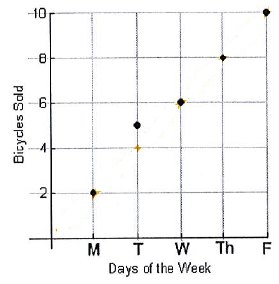
In the scatterplot shown below, which statement best describes the correlation between days of the week and the number of bicycles sold ?

A) High positive correlation B) Low negative correlation
C) High negative correlation D) Low positive correlation
Problem 11 :
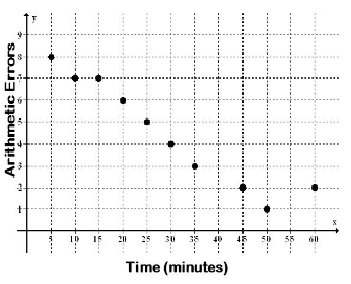
The scatter plot below shows the number of arithmetic errors 10 students made on a quiz and the amount of time the students took to complete the quiz.

Which describes the relationship between the number of arithmetic errors the students made and the amount of the time the students took to complete the quiz ?
A) There is a strong positive relationship between the variables
B) There is a strong negative relationship between the variables.
C) There is a weak positive relationship between the variables
D) There is a weak negative relationship between the variables.
Recent Articles
-
Finding Range of Values Inequality Problems
May 21, 24 08:51 PM
Finding Range of Values Inequality Problems -
Solving Two Step Inequality Word Problems
May 21, 24 08:51 AM
Solving Two Step Inequality Word Problems -
Exponential Function Context and Data Modeling
May 20, 24 10:45 PM
Exponential Function Context and Data Modeling