READING DOT PLOTS AND FREQUENCY TABLES
The dot plot is a visual representation of a number line that shows the value that occurs a number of times in data using dots.
Frequency is the number of times a data value is repeating.
Problem 1 :
Grade 3 students estimated how much television they watch each week, to the nearest hour. The dot plot shows the data.
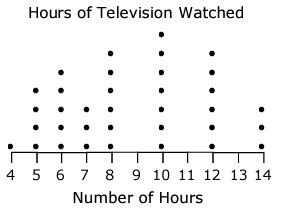
How many students watched TV more than 9 hours and less than 14 hours ?
a) 9 b) 10 c) 11 d) 13
Solution :
More than 9 hours and less than 14 hours means, the number of students who are watching TV at 10, 11, 12, 13 hours.
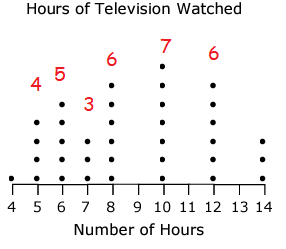
= 7 + 6
= 13 hours
So, option d is correct.
Problem 2 :
A teacher asked 20 students how many books they read last summer. The dot plot displays the data.
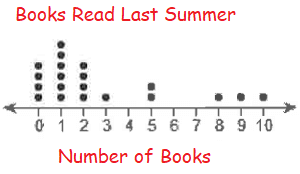
a) What is the greatest number of books a student read ?
b) How many students read 0 books?
Solution :
a) How we are understanding the dot plot ?
- 4 students read 0 books (no books)
- 6 students read 1 book.
- 4 students read 2 books.
- 1 student read 3 books.
- 2 students read 5 books
- 1 student read 8 books
- 1 student read 9 books
- 1 student read 10 books.
10 books read by 1 student is the greater.
b) 4 students read 0 books.
Problem 3 :
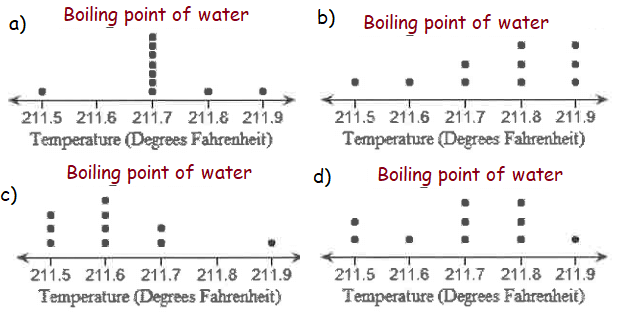
A scientist measured the temperature at which water boils. The table shows the results for 10 measurements.
Boiling point of water
211.5 211.6 211.7 211.5 211.8
211.8 211.7 211.8 211.7 211.9
Which data plot represent the data ?
Solution :
From the given data, let us create frequency table.
211.5 211.6 211.7 211.5 211.8
211.8 211.7 211.8 211.7 211.9
|
Temperature 211.5 211.6 211.7 211.8 211.9 |
Frequency 2 1 3 3 1 |
This frequency table is represented in option d. So, option d is correct.
Problem 4 :
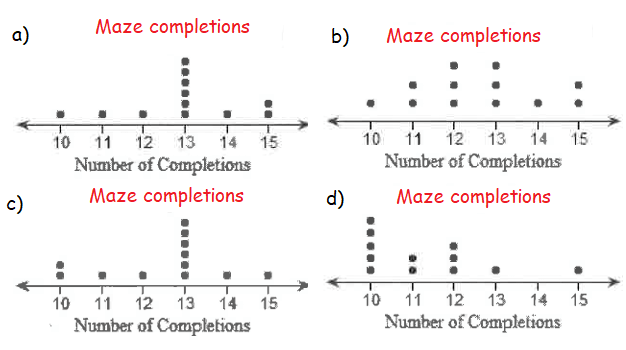
Researcher recorded the number of times lab rats completed a maize in 30 minutes. The table shows the data for 12 rats.
Maze Completions
15 12 15 12
13 11 10 13
11 14 12 13
Which dot plot represent the data ?
Solution :
Maze Completions
15 12 15 12
13 11 10 13
11 14 12 13
|
Maze completions 10 11 12 13 14 15 |
Frequency 1 2 3 3 1 2 |
It is represented in option b. So, option b is correct.
Problem 5 :
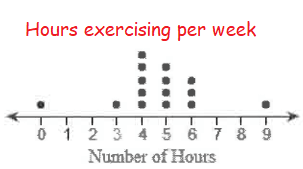
A doctor asked 15 people how many hours they spend exercising each week. The dot plot displays the data.
What do any cluster and gaps in the dot plot, tell you about the exercise habits of these people ?
Solution :
Most of the people, they do exercise 4 hours in a week.
Problem 6 :
The 25 students in a math class took turns flipping a coin 20 times each. the teacher recorded the number of times the result was heads. The dot plot displays the data.
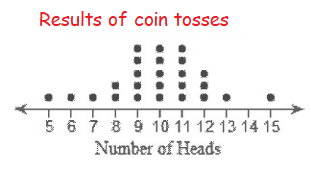
How many students got 9 or 10 heads in 20 flips ?
Solution :
- 9 heads got by 5 students
- 10 heads got by 5 students
10 students got 9 heads or 10 heads
Recent Articles
-
Finding Range of Values Inequality Problems
May 21, 24 08:51 PM
Finding Range of Values Inequality Problems -
Solving Two Step Inequality Word Problems
May 21, 24 08:51 AM
Solving Two Step Inequality Word Problems -
Exponential Function Context and Data Modeling
May 20, 24 10:45 PM
Exponential Function Context and Data Modeling