PROBLEMS ON READING DOT PLOTS
Subscribe to our ▶️ YouTube channel 🔴 for the latest videos, updates, and tips.
Problem 1 :
The list shows the number of minutes it took each student in a class to present a science project.
12 10 18 20 14 14 10 18 20 10 16 14 18 16 18
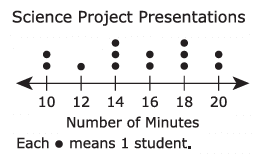
Cecelia is making the dot plot shown to display the data. Which two data points does Cecelia still need to add to the dot plot?
Solution :
Let us create a frequency table, from the data given in the question
12 10 18 20 14 14 10 18 20 10 16 14 18 16 18
|
Minutes taken 10 12 14 16 18 20 |
Number of students 3 1 3 2 4 2 |
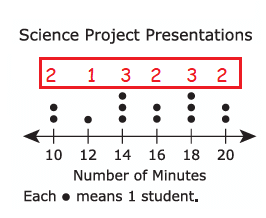
Comparing the frequency table and dot plot given, need to add 1 dot at 10 and 18 respectively.
Problem 2 :
The dot plots show the numbers of apples picked by members of two different tour groups at an orchard.
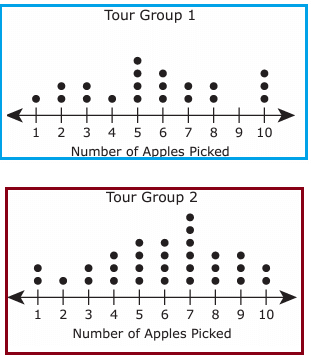
Which statement correctly compares these two data sets?
a) The median of the data is the same for both data sets.
b) The mode of the data is the same for both data sets.
c) The range of the data is the same for both data sets.
d) The distribution of the data is symmetrical for both data sets.
Solution :
Let us find median, mode and range from the above dot plots one by one.
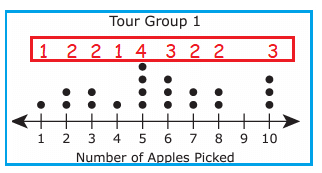
Median :
Total number of apples picked
= 1 + 2 + 2 + 1 + 4 + 3 + 2 + 2 + 3
= 20
Median will be 20/2 ==> 10th value
5 is the median.
Mode :
Most repeated value is 5. So, mode is 5.
Range :
Range = Largest value - Smallest value
= 10 - 1
= 9
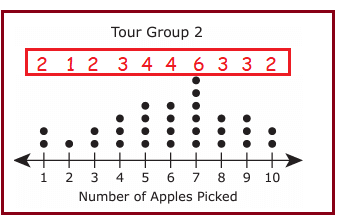
Median :
Total number of apples picked
= 2 + 1 + 2 + 3 + 4 + 4 + 6 + 3 + 3 + 2
= 30
Median will be 30/2 ==> 15th value
7 is the median.
Mode :
Most repeated value is 7. So, mode is 7.
Range :
Range = Largest value - Smallest value
= 10 - 1
= 9
From the analysis done with above dot plots, we observe common range for both data. So, option D is correct.
Problem 3 :
The dot plot shows the number of packages mailed by the last 20 customers at a post office.
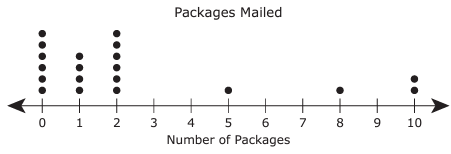
Which statement best describes the data shown in the dot plot?
a) The data distribution has gaps.
b) The data distribution is symmetrical.
c) The data are clustered at 5.
d) The peak of the data is at 10.
Solution :
The data has gaps, because there is no entry in the middle.
Problem 4 :
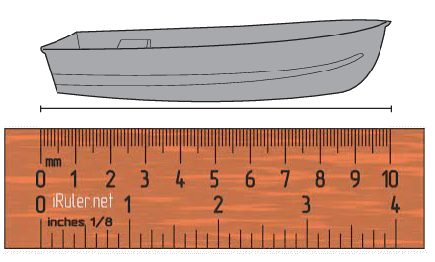
The list shows the lengths in centimeters of some toy boats. The length of one toy boat is missing.
5, 5, 6, 10, 8, 5, ___

Which dot plot represents the lengths of all of the toy boats?
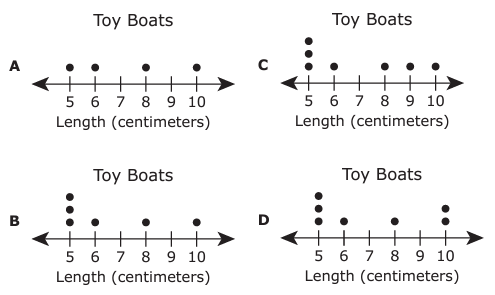
Solution :
Creating frequency table,
5, 5, 6, 10, 8, 5
|
Length 5 6 8 10 |
Frequency 3 1 1 1 |
After we measure using the ruler, 10 should be repeated 2 times.
So, option D is correct.
Problem 5 :
The dot plot shows the number of tickets needed for each ride at a carnival.
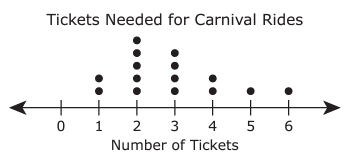
What is the difference between the number of rides that need fewer than 4 tickets and the number of rides that need 4 or more tickets?
a) 7 b) 2 c) 9 d) 4
Solution :
1, 2, 3 are tickets fewer than 4.
Adding the dots in 1, 2 and 3.
2 + 5 + 4
= 11
4 or more tickets :
= 2 + 1 + 1
= 4
Difference between them = 11 - 4
= 7
So, option a is correct.
Subscribe to our ▶️ YouTube channel 🔴 for the latest videos, updates, and tips.
Recent Articles
-
Finding Range of Values Inequality Problems
May 21, 24 08:51 PM
Finding Range of Values Inequality Problems -
Solving Two Step Inequality Word Problems
May 21, 24 08:51 AM
Solving Two Step Inequality Word Problems -
Exponential Function Context and Data Modeling
May 20, 24 10:45 PM
Exponential Function Context and Data Modeling