PROBLEMS ON PIE CHART
A Pie chart is a useful way of displaying how a quantity is divided up. A full circle represents the whole quantity.
We divide the circle into sectors or wedges to show each type or category.
Problem 1 :
The pie chart shows the result of a survey of 120 year 7 students. The students were asked the question: What is the favorite sport ?
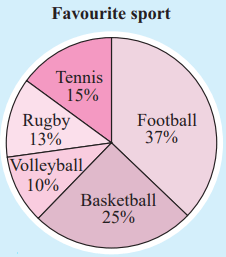
Use the chart to determine :
a) The most popular sport
b) the least popular sport
c) the number of students whose favorite sport is basket ball
d) the number of students whose favorite sport is tennis.
Solution :
a) The most popular sport is football.
b) the least popular sport volley ball.
c) Total number of students = 120
Percentage of students whose favorite sport is basket ball
= 25%
= 25% of 120
= 0.25 (120)
= 30
So, 30 students whose favorite sport is basketball.
d) Percentage of students whose favorite sport is tennis
= 15%
= 15% of 120
= 0.15 (120)
= 18
Problem 2 :
The pie chart alongside illustrates the proportion of water required for various household uses.
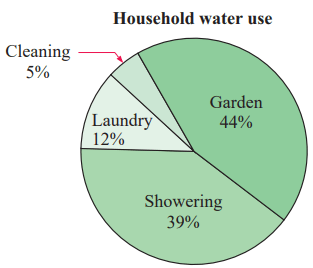
a) For what purpose is the most water used?
b) For what purpose is the least amount of water used?
c) If the household used 400 kilolitres of water during a particular period, estimate the quantity of water used for:
i) showering ii) cleaning
Solution :
a) The most water is used for showering.
b) Least amount of water is used for cleaning.
c) Quantity of water used for house hold = 400 kiloliters
i) Quantity of water used for showering = 39% of 400
= 0.39 (400)
= 156 kiloliters
Quantity of water is used for showering = 156 kiloliters.
ii) Quantity of water used for cleaning = 5% of 400
= 0.05 (400)
= 20 kiloliters
Quantity of water is used for cleaning = 20 kiloliters.
Problem 3 :
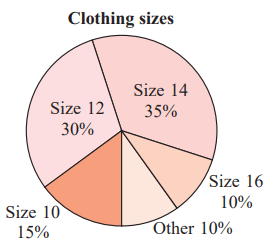
The pie chart alongside shows the percentages of women in France who wear certain sizes of clothing.
a) Find what size is most commonly worn.
b) A group of 200 women attends a fashion parade.
Estimate how many would wear size 10 clothing
Solution :
a) The most commonly worn size is 12.
b) Number of women attending the fashion parade = 200
Percentage of women who are wearing size 10 = 15%
= 15% of 200
= 0.15(200)
= 30
Problem 4 :
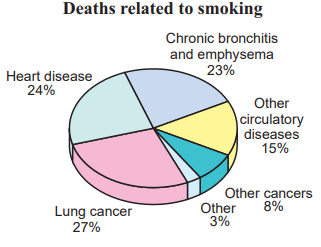
a) What was the major disease causing death as a result of smoking?
b) What 2 groups of diseases made up 50% of all smoking related deaths?
c) If 20 000 people died in one year as a result of smoking, estimate how many died from:
i) heart disease
ii) lung cancer
iii) other cancers?
Solution :
a) major disease causing death as a result of smoking
= lung cancer
b) lung cancer and chronic bronchitis and emphysema
c) Total number of people died in one year = 20000
i) Number of people dies in heart disease = 24% of 20000
= 0.24 (20000)
= 4800
ii) Number of people dies in lung cancer = 27% of 20000
= 0.27 (20000)
= 5400
iii) Number of people dies in other cancers = 8% of 20000
= 0.08 (20000)
= 1600
Problem 5 :
A youth club has two rugby teams, Under 13ʼs and Under 15ʼs. The pie charts show information about the number of games each team won and lost, last season.
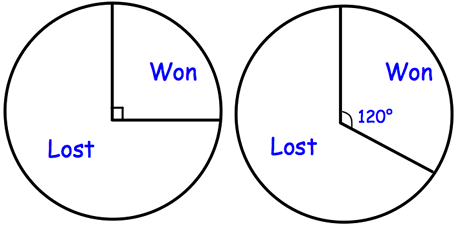
- The Under 13ʼs played 28 matches.
- The Under 15ʼs played 18 matches.
Which team won more matches? Show your workings.
Solution :
Number of matches won by Under 13's = (90/360) x 28
= 7 matches
Number of matches won by Under 15's = (120/360) x 18
= 6 matches
So, under 13's won more number of matches.
Problem 6 :
The pie chart shows types of properties in a street with 80 properties.
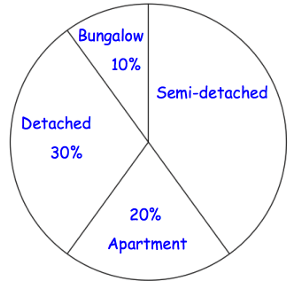
(a) Work out the percentage of properties that are semi-detached. ..............................%
(b) Work out the number of semi-detached properties.
Solution :
a) Percentage that are semi detached
= 100% - (10% + 30% + 20%)
= (100 - 60)%
= 40%
b) Number of semi detached properties = 40% of 80
= 0.40(80)
= 32 properties
Recent Articles
-
Finding Range of Values Inequality Problems
May 21, 24 08:51 PM
Finding Range of Values Inequality Problems -
Solving Two Step Inequality Word Problems
May 21, 24 08:51 AM
Solving Two Step Inequality Word Problems -
Exponential Function Context and Data Modeling
May 20, 24 10:45 PM
Exponential Function Context and Data Modeling