PROBLEMS ON INTERPRETING GRAPHS WITH BAR GRAPH DOT PLOT AND PIE CHART
Problem 1 :
Rob earns $80 a week. Each week he uses the same portion of his pay for food, clothing, transportation, saving, and other expenses.
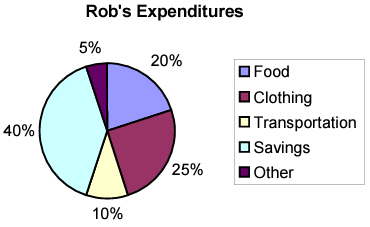
Based on the circle graph, calculate how much Rob spends on each category.
- Food
- Clothing
- Transportation
- Savings
- Other
Solution :
His earning = $80
Amount spent for food = 20% of 80
= 0.20(80)
= 16
Amount spent for clothing = 25% of 80
= 0.25(80)
= 20
Amount spent for transportation = 10% of 80
= 0.10(80)
= 8
Amount spent for savings = 40% of 80
= 0.40(80)
= 32
Amount spent for other = 5% of 80
= 0.05 (80)
= 4
Problem 2 :
The weights of four athletes are displayed below.
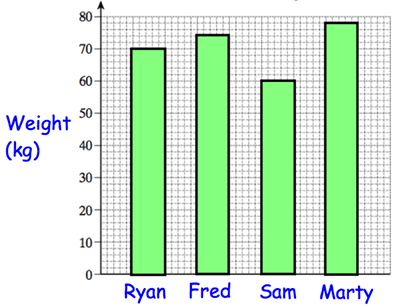
(a) Who is the lightest athlete?
(b) Write down Martyʼs weight. _____kg
(c) Work out the range of the weights
Solution :
a) Since Sam is weighting less, he is the lightest athlete.
b) Marty's weight is 78 kg.
c) Heaviest athlete is Marty (weight is 78 kg)
Lightest athlete is Sam (weight is 60 kg)
Range = 78 - 60
= 18 kg
Problem 3 :
Anne-Marie has drawn a bar chart to show the eye colours in class 8D.
(a) How many students are there in class 8D?
(b) What fraction of the students have brown eyes?
(c) What fraction of the students have blue eyes?
(d) What fraction of the students have green eyes?
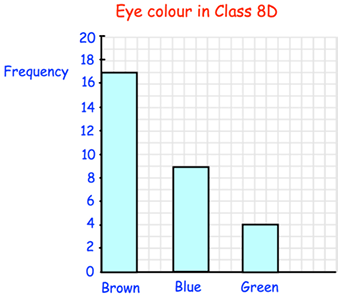
a) Number of students in class = 17 + 9 + 4
= 30
(b) Number of students with brown color eye = 17
= 17/30
(c) Number of students with blue eye = 9
= 9/30
(d) Number of students with green green color eye = 4
= 4/30
Problem 4 :
The given pie chart represents the sale of $100 000 worth of goods by a sports store during its February sale.
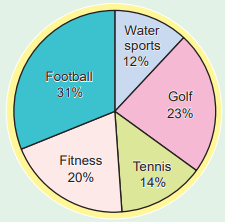
a) Gear for which sport sold best ?
b) What value of goods for water sports and tennis was sold ?
c) The same percentage of goods was sold in the sports store's 1/2 million dollar End of the sale
i) What value of fitness gear was sold ?
ii) What was the total amount of tennis and water sports sales ?
Solution :
a) foot ball
b) 12% + 14% ==> 26%
= 26% of 100 000
= 0.26(100 000)
= 26000
c) 1/2 million dollar = 1/2 of 1,000,000
= 500000
i) Sales price of fitness gear = 20% of 500000
= 0.20(500000)
= 100000
ii) Tennis and water sports = 14% + 12%
= 26%
= 26% of 500000
= 0.26(500000)
= 130000
Problem 5 :
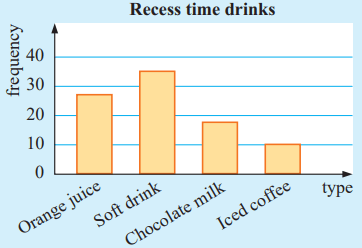
The graph given shows the types of drink purchased by students at recess time.
a) What is the least popular drink?
b) What is the mode of the data?
c) How many students drink orange juice?
d) What percentage of students drink chocolate milk?
Solution :
a) The least popular drink = 10
b) Mode = 35
c) Number of students who drink orange juice
= 27 (approximately)
d) Number of students who drink chocolate milk = 18
Total number of students = 27 + 35 + 18 + 10
= 90
Percentage of students who drink chocolate milk
= (18/90) x 100%
= 2 x 10%
= 20%
Problem 6 :
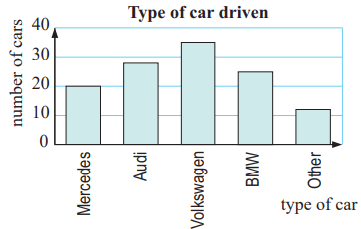
The column graph shows the type of vehicle driven by 120 randomly selected people in Munich.
a) Use the graph to estimate the frequency of each type of car.
b) Which make of car is the most popular?
c) What percentage of the surveyed people drive an Audi?
Solution :
a) Number of people who prefer,
- Mercedes = 20
- Audi = 28
- Volkswagen = 35
- BMW = 25
- Other = 12
b) The most popular Volkswagen.
c) Number of people who drive Audi = 28
Converting into percentage, we get = (28/120) x 100%
= 0.2333... (100%)
= 23.3%
Problem 7 :
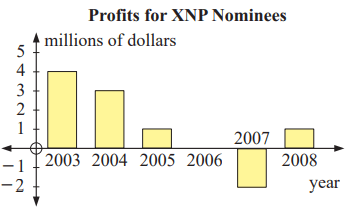
3 Yearly profit and loss figures for a business can be easily illustrated on a column graph. For the example given:
a) in what years was a profit made
b) what happened in 2006
c) what was the overall profit or loss over the 6-year period?
Solution :
a) Profit made in the years
2003, 2004, 2005 and 2008.
b) There is no profit and no loss, so break even point.
c) Profit in the year 2003 = 4 million
In the year 2004 = 3 million
In the year 2005 = 1 million
In the year 2007 = loss 2 million
In the year 2001 = 1 million
Total profit = 4 + 3 + 1 + 1 ==> 9 million
Loss = 2 million
Profit = 9 - 2
= 7 million.
Recent Articles
-
Finding Range of Values Inequality Problems
May 21, 24 08:51 PM
Finding Range of Values Inequality Problems -
Solving Two Step Inequality Word Problems
May 21, 24 08:51 AM
Solving Two Step Inequality Word Problems -
Exponential Function Context and Data Modeling
May 20, 24 10:45 PM
Exponential Function Context and Data Modeling