PROBLEMS ON INTERPRETING BAR GRAPHS
Subscribe to our ▶️ YouTube channel 🔴 for the latest videos, updates, and tips.
Problem 1 :
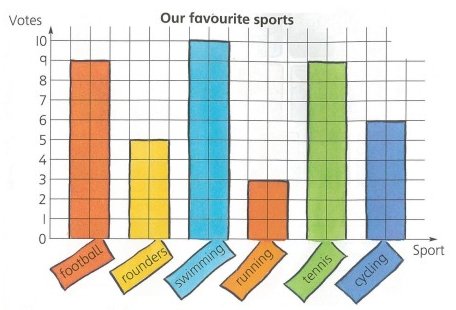
1. How many vote for:
|
a. football? _____ b. cycling? _____ c. swimming? _____ |
d. rounders? _____ e. tennis? _____ f. running? _____ |
2. Which sports is:
a. most popular?
b. least popular?
3. Which sports had:
a. more than 4 votes?
b. fewer than 7 votes?
4. How many children voted in total?
Solution:
1.
|
a. football = 9 b. cycling = 6 c. swimming = 10 |
d. rounders = 5 e. tennis = 9 f. running = 3 |
2.
a. most popular sport is swimming.
b. least popular sport is running.
3.
a. more than 4 votes sports is football, rounders, swimming, tennis and cycling.
b. fewer than 7 votes sports is rounders, running and cycling.
4. Total = 9 + 5 + 10 + 3 + 9 + 6
= 42
There are 42 students voted.
Problem 2 :
All year 4 students at the Happy School were asked to choose their most favorite ice cream flavour.
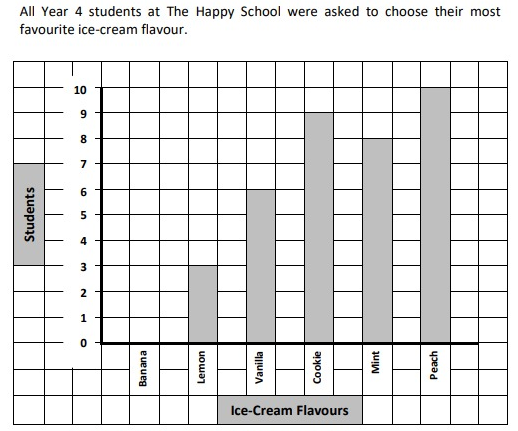
1. How many students like cookie ice-cream?
2. How many more students prefer peach than vanilla ice-cream?
3. There are 42 year 4 students at Victoria Primary School in all.
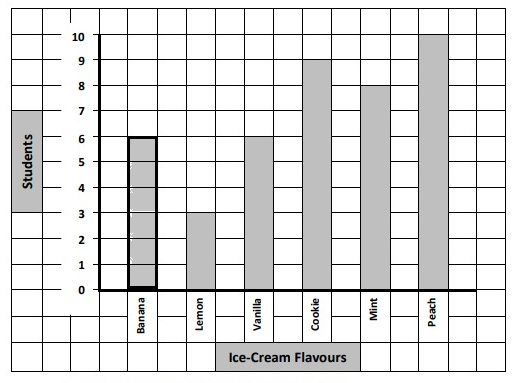
a) Calculate how many students like banana ice-cream ?
b) Complete the bar graph by drawing the banana bar.
Solution:
1. 9 students like cookie ice-cream.
2. 4 more students prefer peach than vanilla ice-cream.
3.
a) Let x be Banana ice cream.
42 = x + 3 + 6 + 9 + 8 + 10
42 = 36 + x
x = 42 - 36
x = 6
6 students like banana ice-cream.
b)
Problem 3 :
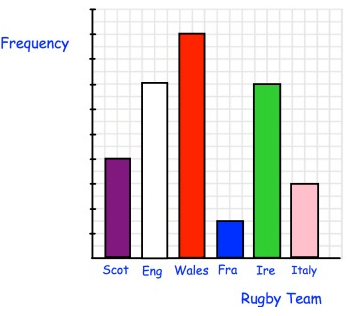
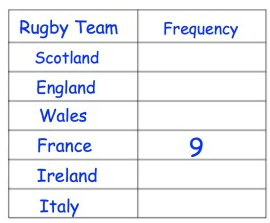
Nigel has asked his friends which country they support in the Six Nations. He has shown the results in a bar chart.
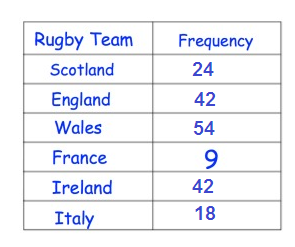
The bar chart is accurately drawn, but Nigel has forgotten to label the frequencies Nigel does remember that 9 people supported France.
Find the missing frequencies.
Solution:
Each grid represent 3 units.
Problem 4 :
The bar chart shows the ages of children in a youth club.
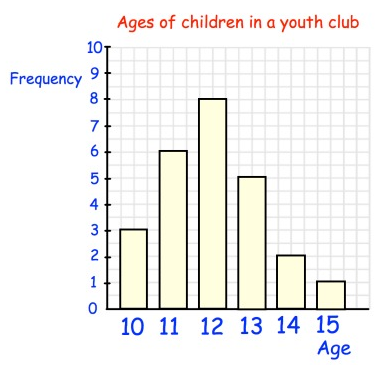
a) What is the modal age?
b) What is the range of the ages?
c) What fraction of the children are 11?
d) What percentage of the children are older than 13?
Solution:
a)
b)
Range of the ages = maximum - minimum
= 15 - 10
= 5
c)
fraction of the children are 11 = 6/25
= 0.24
d)
older than 13 = 3/25
= 0.12
= 12%
Problem 5 :
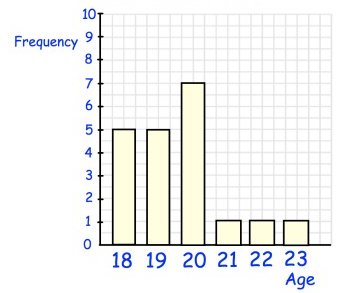
Shown are the ages of 20 friends. Work out the mean age.
Solution:
Problem 6 :
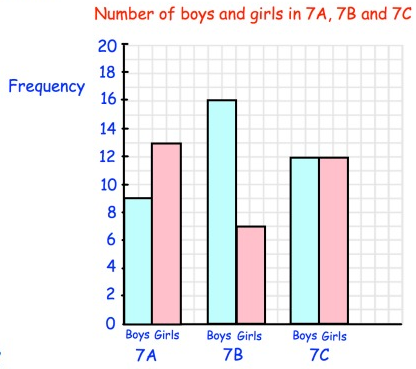
The dual bar chart shows information about the number of boys and girls in three tutor groups, 7A, 7B and 7C.
a) How many boys are there in 7B?
b) Which tutor group has 12 girls?
c) Which tutor group has more girls than boys?
d) Which tutor group has the same number of boys and girls?
e) Which tutor group has the most students?
f) How many more girls than boys are there in 7A?
g) How many boys are there in Year 7?
h) How many students are there in Year 7?
i) Are there more boys or girls in Year 7?
Solution:
a) 16 boys are there in 7B.
b) 7C tutor group has 12 girls.
c) 7A tutor group has more girls than boys.
d) 7C tutor group has the same number of boys and girls.
e) 7C tutor group has the most students.
f) 4 more girls than boys are there in 7A.
g)
= 9 + 16 + 12
= 37
37 boys are there in Year 7.
h)
= 9 + 13 + 16 + 7 + 12 + 12
= 69
69 students are there in Year 7.
i) yes.
Problem 7 :
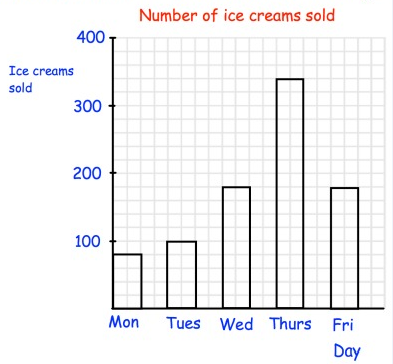
The bar chart shows information about the number of ice creams sold in a shop.
a) How many ice creams were sold on Tuesday?
b) On which day were the least number of ice creams sold?
c) Why do you think so many ice creams were sold on Thursday?
d) On which two days were the same number of ice creams sold?
e) How many ice creams were sold in total?
Solution:
a) 100 ice creams were sold on Tuesday.
b) Monday were the least number of ice creams sold.
c) It may be festival on that day.
d) Wednesday and Friday were the same number of ice creams sold.
e) 880 ice creams were sold in total.
Subscribe to our ▶️ YouTube channel 🔴 for the latest videos, updates, and tips.
Recent Articles
-
Finding Range of Values Inequality Problems
May 21, 24 08:51 PM
Finding Range of Values Inequality Problems -
Solving Two Step Inequality Word Problems
May 21, 24 08:51 AM
Solving Two Step Inequality Word Problems -
Exponential Function Context and Data Modeling
May 20, 24 10:45 PM
Exponential Function Context and Data Modeling