PROBLEMS ON CATEGORICAL DATA
Subscribe to our ▶️ YouTube channel 🔴 for the latest videos, updates, and tips.
What is categorical data ?
Categorical data is data which can be placed in categories.
For example, suppose we stand at a street intersection and record the color of each car going past.
We use the code R = red, B = blue, G = green, W = white, O = other colors to help us record the data efficiently.
The following results were observed in a sample of 50 cars:
BGWWR BBGGW OGWRW WWWOG OOBBG
WOBWW OGRWR RWWRB WWWGB OOBWR
Having collected our categorical data, we first organize it in groups.
We can do this using either
- a dot plot
- tally or frequency table
Problem 1 :
At recess time the sales of drinks were recorded over a three minute period.
O = 100 plus, S = soy milk, C = cola, I = iced tea.
The data was
OSSCI OCISO IOCSO OOOSC SOCOS SOOCO OIOIS
a) Draw a dot plot of the data.
b) What is the mode?
Solution :
a)
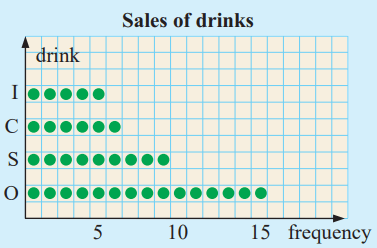
- Number of I's = 5
- Number of C's = 6
- Number of S's = 9
- Number of O's = 15
- Total number of drinks = 35
Representing the data in dot plot
Horizontal axis - frequency and vertical axis - drinks
b) Mode
Most repeated variable is O, so mode is 100 plus.
Problem 2 :
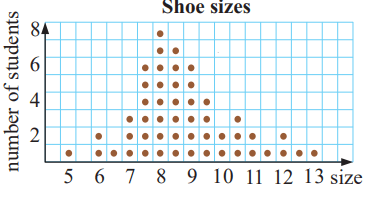
The dot plot shows shoe sizes for students in grade .
a) How many students are in grade 6 at this school?
b) How many have shoe size 9 or more?
c) What percentage have shoe sizes 8 or more?
Solution :
a) To find the number of students in the school, we have to add all.
Number of students with shoe size 5 = 1
Number of students with shoe size 6 = 2
Number of students with shoe size 6.5 = 1
Number of students with shoe size 7 = 3
Continuing in this way, we get
= 1 + 2 + 1 + 3 + 6 + 8 + 7 + 6 + 4 + 2 + 3 + 2 + 1 + 2 + 1 + 1
= 50
b) Number of students who are having their shoe size 9 or more
= 6 + 4 + 2 + 3 + 2 + 1 + 2 + 1 + 1
= 22
c) Number of students who are having their shoe sizes 8 or more
= 7 + 6 + 4 + 2 + 3 + 2 + 1 + 2 + 1 + 1
= 29
Converting into percentage = (29/50) x 100%
= 58%
Problem 3 :
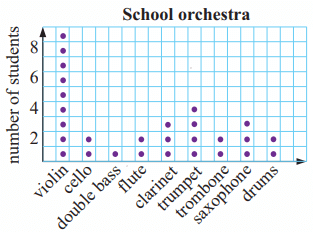
The dot plot shows the numbers of students playing various instruments in the school orchestra.
a) How many play stringed instruments?
b) How many students are in the orchestra?
c) Find the mode of the data.
Solution :
a) Violin and Cello are the two stringed instruments.
b) Violin = 9, Cello = 2, Double bass = 1
Flute = 2, Clarinet = 3, trumpet = 4, trombone = 2
Saxophone = 3, drums = 2
= 9 + 2 + 1 + 2 + 3 + 4 + 2 + 3 + 2
= 28
There are 28 students in the orchestra
c) There are many students playing the instrument Violin. So, this is the mode.
Problem 4 :
A class of students at a school in England were asked which summer sport they wanted to play. The choices were:
T = tennis, S = swimming, C = cricket, B = basketball and F = football. The data was:
FFCTC CSFST TTBFS FFCSF TFTBC
a) Draw a horizontal dot plot of the data.
b) Find the mode of the data.
Solution :
a)
Number of students who were choosing
- Tennis T = 6
- Swimming S= 4
- Cricket C = 5
- Basketball B = 2
- Foot ball F = 8
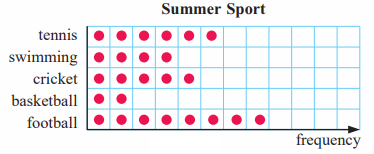
b) Mode of the data is foot ball.
Problem 5 :
Students voted the most popular attractions at the local show to be the side shows (S), the farm animals (F), the ring events (R), the dogs and cats (D), and the wood chopping (W). The students in a class were then asked to name their favourite.
The data was:
SRWSS WFDDS RRFWS RSRWS SRRRF
a) Draw a vertical dot plot of the data.
b) Find the mode of the data.
Solution :
a)
- Number of side shows S's = 8
- Number of farm animals F's = 3
- Number of ring event R's = 8
- Number of dogs and cats D' = 2
- Number of wood chopping W's = 4
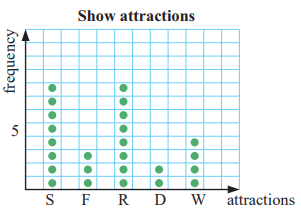
b) The mode is side shows and ring events.
Subscribe to our ▶️ YouTube channel 🔴 for the latest videos, updates, and tips.
Recent Articles
-
Finding Range of Values Inequality Problems
May 21, 24 08:51 PM
Finding Range of Values Inequality Problems -
Solving Two Step Inequality Word Problems
May 21, 24 08:51 AM
Solving Two Step Inequality Word Problems -
Exponential Function Context and Data Modeling
May 20, 24 10:45 PM
Exponential Function Context and Data Modeling