PROBLEMS ON BAR GRAPH
Problem 1 :
The bar graph shows the amount of time Jennifer and Janson spent practicing their Piano lessons last week.
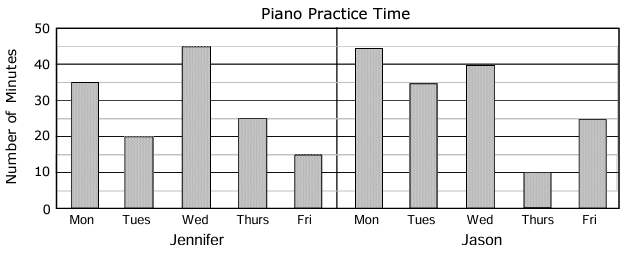
How many more minutes did Jason spend practicing piano lessons than Jennifer on Tuesday ?
Solution :
Number of hours Jennifer has practiced = 20
Number of hours Jason has practiced = 35
Difference between these two hours = 35 - 20
= 15 hours
Jason has practice 15 more hours than Jennifer.
Problem 2 :
The manager of Callie's Card Shop made a graph of the number of birthday cards sold during the months of January, February, March, April, May and June. The graph shows that 45 cards were sold during the first three months.
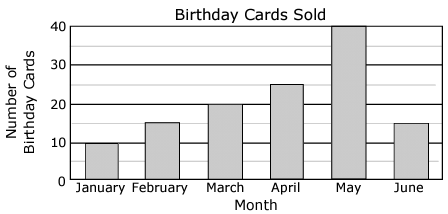
How many more cards were sold during the last three months than during the first three months ?
Solution :
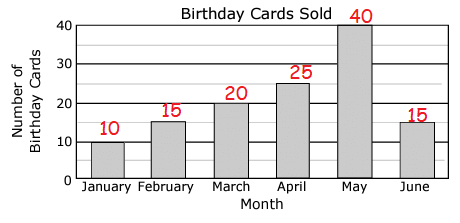
Number of birthday cards sold in first three months
= 10 + 15 + 20
= 45
Number of birthday cards sold in last three months
= 25 + 40 + 15
= 80
Difference = 80 - 45
= 35
So, there are 35 more cards sold in last three month than first three months of the year.
Problem 3 :
Mr. Maynard has 6 rows of tomato plants in the garden. On Thursday he counted the number of grosshoppers that were on tomato plants in each row. The information he recorded and shown in the graph below.
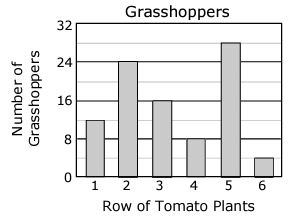
How many grosshoppers altogether did he count on the tomato plants in Row 1, Row 3 and Row 5 ?
Solution :
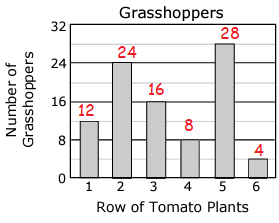
Number of grosshoppers in Row 1, 3 and 5
= 12 + 16 + 28
= 56
Problem 4 :
Will is making in graph to show the number of pages of quarters collected by each of four students for their coin collection books.
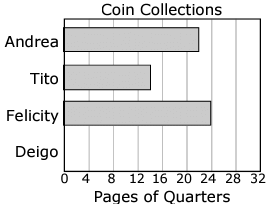
Deigo collected 8 more pages of quarters than Tito collected. Which bar can be used to complete the graph for Deigo ?

Solution :
Number of quarters collected by Tito = 14
Number of quarters collected by Deigo = 14 + 8
= 22
So, option b is correct.
Problem 5 :
The graph shows the amount of snow that fell on a ranch in Texas during 4 months.
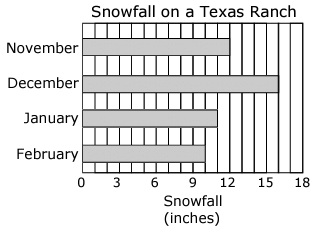
How many more inches of snow fell on the ranch in December than in February ?
a) 15 inches b) 25 inches c) 10 inches d) 6 inches
Solution :
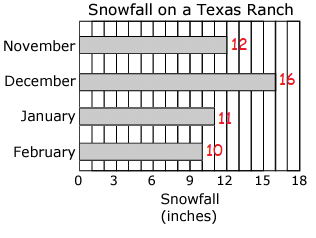
Number of inches snow fell in the month December = 16
Number of inches snow fell in the month February = 9
= 16 - 10
= 6
Recent Articles
-
Finding Range of Values Inequality Problems
May 21, 24 08:51 PM
Finding Range of Values Inequality Problems -
Solving Two Step Inequality Word Problems
May 21, 24 08:51 AM
Solving Two Step Inequality Word Problems -
Exponential Function Context and Data Modeling
May 20, 24 10:45 PM
Exponential Function Context and Data Modeling