MEAN MEDIAN MODE FROM FREQUENCY TABLE
Subscribe to our ▶️ YouTube channel 🔴 for the latest videos, updates, and tips.
Problem 1 :
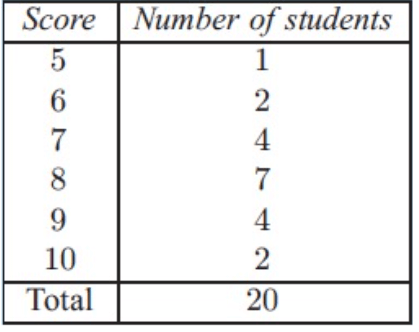
A class of 20 students all take a spelling test. Their results out of 10 are shown in the table.
Calculate :
a) Mean b) Median c) Mode
Solution :
a) Mean :
= Total score / total number of students
Total score = 5(1) + 6(2) + 7(4) + 8(7) + 9(4) + 10(2)
= 5 + 12 + 28 + 56 + 36 + 20
= 157
Total number of students = 20
Mean = 157/20
= 7.85
b) Median :
Total number of scores = 20
Median will be the average of 10th and 11th values. By observing the table, 10th value and 11th value will be 8.
Median = (8 + 8)/2
= 8
c) Mode :
Highest frequency of score is 8.
Mode = 8
Problem 2 :
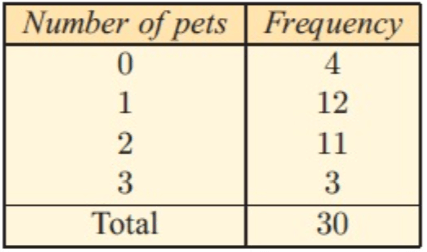
A class of 30 students were asked how many pets they owned. The following data was obtained.
Calculate :
a) Mean b) Median c) Mode
Solution :
a) Mean :
= Total number of pets / total number of students
Total number of pets = 0(4) + 1(12) + 2(11) + 3(3)
= 0 + 12 + 22 + 9
= 43
Total number of students = 30
Mean = 43/30
= 1.43
b) Median :
Total number of scores = 20
Median will be the average of 15th and 16th values. By observing the table, 15th value and 16th value will be 1.
Median = (1 + 1)/2
= 1
c) Mode :
Highest frequency of score is 1.
Mode = 1
Problem 3 :
Sarah recorded the number of occupants in each car that drove down her street one day. The results are shown in the frequency columns graph.
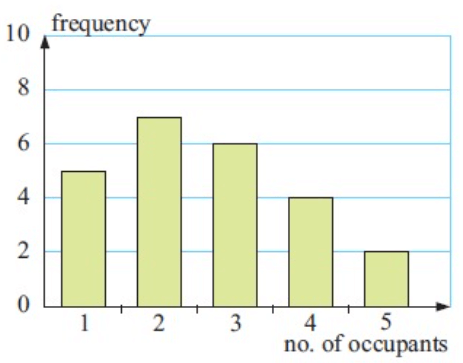
a) Construct a frequency table from the graph.
b) How many cars did Sarah record data for ?
c) Find the
i) Mean ii) Median iii) Mode
Solution :
a)
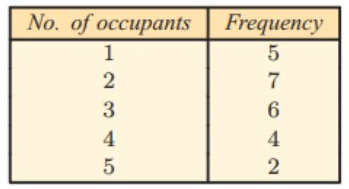
b) Number of cars recorded = 5 + 7 + 6 + 4 + 2
= 24 cars
c) i) Mean :
= [1(5) + 2(7) + 3(6) + 4(4) + 5(2)]/24
= (5 + 14 + 18 + 16 + 10)/24
= 63/24
= 2.625
ii) Median :
Median = Average of 12th and 13th value
= (2 + 3)/2
= 5/2
= 2.5
iii) Mode :
The highest frequency is 7.So, mode is 2.
Problem 4 :
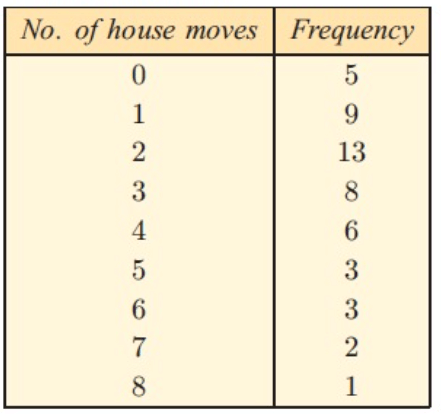
50 people were asked how many times they had moved house. The results are given in the frequency table.
a) For this data, find the
i) Mean ii) Median iii) Mode
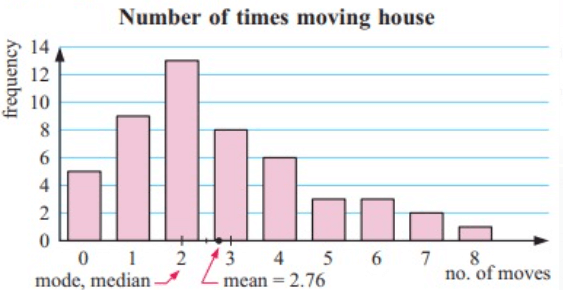
b) Construct a column graph for the data and show the position of the measures of of center on the horizontal axis.
Solution :
i) Mean :
Total number of house moves =
0(5) + 1(9) + 2(13) + 3(8) + 4(6) + 5(3) + 6(3) + 7(2) + 8(1)
= 0 + 9 + 26 + 24 + 24 + 15 + 18 + 14 + 8
= 138
Mean = 138 /50
= 2.76
ii) Median :
Median = Average of 25th + 26th values
= (2+2)/2
= 2
iii) Mode :
The highest frequency is 13 for the data 2. So, mode is 2.
b)
Problem 5 :
The bar graph shows the numbers of hours you volunteered at an animal shelter. What is the minimum number of hours you need to work in the seventh week to justify that you worked an average of 10 hours for the 7 weeks? Explain your answer using measures of center.

Solution :
Given that, Average = 10
Number of hours working for 6 days = 6 + 15 + 11 + 7 + 10 + 9
Let x be the number of hours he is working on the seventh day.
Total number of hours he is working in all seven days = 58 + x
(58 + x)/7 = 10
58 + x = 7(10)
58 + x = 70
x = 70 - 58
x = 12
So, the required number of hours is 12.
Problem 6 :
The list shows the favorite types of movie for students in a class. Organize the data in a table. Then find the mode.

Solution :
Organizing the data in the table, we get
|
Types of movies Comedy Horror Drama Action |
Frequency 8 7 4 5 |
So, the mode is 8
The number of days that children were missing school due to sickness in one year recorded
|
Number of days off sick 1 - 5 6 - 10 11 - 15 16 - 20 21 - 25 |
Frequency 12 11 10 4 3 |
.a) Estimate mean b) Estimate median c) Estimate mode
Solution :
a) Mean :
|
Number of days off sick 1 - 5 6 - 10 11 - 15 16 - 20 21 - 25 |
Midpoint 3 8 13 18 23 |
Frequency 12 11 10 4 3 |
= [3(12) + 8(11) + 13(10) + 18(4) + 23(3)]/(12 + 11 + 10 + 4 + 3)
= 395 / 40
= 9.875
Median :
As there are 40 pupils, we need to consider mean of the 20th and 21st values. These both lie in the 6-10 class interval, which is really the 5.5 - 10.5 class interval. So, this interval contain the median.
As there are 12 values in the first class interval, the median is found by considering the 8th and 9 th values of the second. As there are 11 values in the second interval, the median is estimated as being
= 8.5/11
of the way along the second interval.
But the length of the second interval is 10.5 - 5.5 = 5, so the median estimated by
= (8.5/11) x 5
= 3.86
From the start of this interval. Therefore the median is estimated by
= 5.5 + 3.86
= 9.36
c) Mode :
The modal class is 1 - 5 as this class contains at most entries.
Subscribe to our ▶️ YouTube channel 🔴 for the latest videos, updates, and tips.
Recent Articles
-
Finding Range of Values Inequality Problems
May 21, 24 08:51 PM
Finding Range of Values Inequality Problems -
Solving Two Step Inequality Word Problems
May 21, 24 08:51 AM
Solving Two Step Inequality Word Problems -
Exponential Function Context and Data Modeling
May 20, 24 10:45 PM
Exponential Function Context and Data Modeling