MEAN MEDIAN MODE SAT PROBLEMS WORKSHEET
Problem 1 :
Gracie regularly buys six different items at the grocery store. The average price of the items is $30. The price of five items are $7, $25, $36, $40 and $44. What is the price of the sixth item ?
Problem 2 :
The table gives the distribution of weights to the nearest pound, for 50 lobsters harvest off the coast of Maine and 50 lobster harvested off the coast of Masschusetts
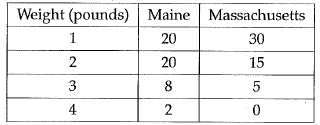
What is the mean weight in pounds, of all the harvested lobsters ?
a) 1.34 b) 1.45 c) 1.67 d) 1.78
Problem 3 :
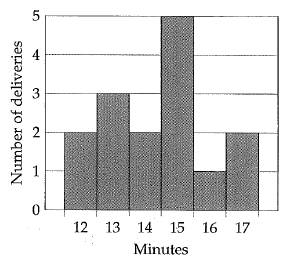
A local pizza restaurant advertises a service that delivers pizza within 15 minutes. The histogram above was produced by a customer who timed the restaurant's delivery service to the nearest minute for 15 deliveries. Based on the mean delivery time, in minutes, of the restaurant ?
a) 14.4 b) 14.8 c) 15.2 d) 15.6
Problem 4 :
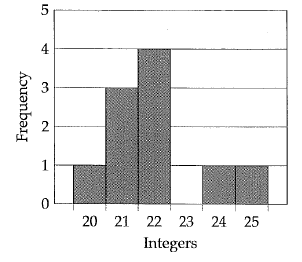
The graph above shows the frequency distribution of a list of randomly generated integers between 20 and 26. what is the mean of the list of integers ?
a) 21.5 b) 22 c) 22.5 d) 23
Problem 5 :
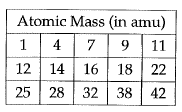
The table above gives the atomic mass, to the nearest amu, of 15 different elements. Based on the table, what is the median atomic mass in amu of these elements ?
Problem 6 :
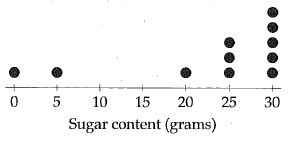
The dotplot above shows the sugar content (in grams) in each of the 11 most popular soft drinks in Japan.
What is the mode of the data set ?
a) 0 b) 23 c) 25 d) 30
Problem 7 :
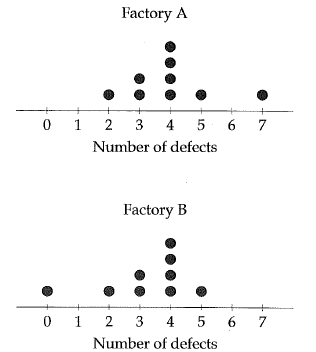
A phone manufacturer is using two different factories to test a new product. The dotplots above show the number defects in 9 products from each factory. Which of the following correctly compares the mean number of defects in the products from each factory ?
a) the mean number of defects in the products from factory A is greater.
b) The mean number of defects in the products from factory B is greater.
c) The mean number of defects in the products from factory A and in factory B is the same.
d) The relationship cannot be determined from the information.
Answer Key
1) the price of the sixth item is $28.
2) the mean is 1.67
3) 14.4 minutes
4) The answer is 22.
5) The median is 16.
6) By observing the dot plot, the mode is 30
7) the mean number of defects in the products from factory A is greater.
Recent Articles
-
Finding Range of Values Inequality Problems
May 21, 24 08:51 PM
Finding Range of Values Inequality Problems -
Solving Two Step Inequality Word Problems
May 21, 24 08:51 AM
Solving Two Step Inequality Word Problems -
Exponential Function Context and Data Modeling
May 20, 24 10:45 PM
Exponential Function Context and Data Modeling