INTERPRETING TREND LINES ON GRAPHS
Subscribe to our ▶️ YouTube channel 🔴 for the latest videos, updates, and tips.
One type of graph that relates two sets of data with plotted ordered pairs is called a scatter plot. Scatter plots are considered discrete graphs because their points are separate and disconnected.
What is trend line ?
The points on scatter plots sometimes form a linear pattern. In these situations, a line can be drawn to model the pattern, which is called a trend line.
A trend line is a line on a scatter plot, which shows the relationship between two sets of data.
Problem 1 :
Angela recorded the price of different weights of several bulk grains. She made a scatter plot of her data. Use the scatter plot for the questions given below.
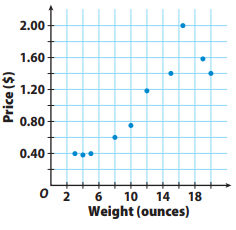
1) Draw a trend line for the scatter plot.
2) How do you know whether your trend line is a good fit for the data?
3) Write an equation for your trend line.
4) Use the equation for your trend line to interpolate the price of 7 ounces and extrapolate the price of 50 ounces.
Solution :
a)
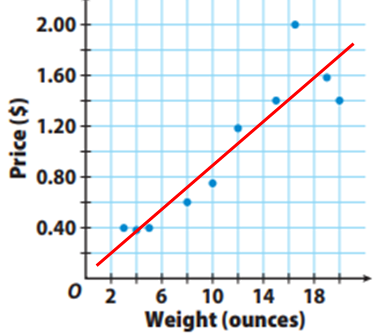
b) The points are closer to the trend line. So, it is correct.
c) Choose two points from the scatter plot, it may on the line or points very closer to the line of best fit.
(1, 0.04) and (12, 1.20)
Slope (m) = (1.20 - 0.04) / (12 - 1)
= 1.16/11
= 0.10
Equation of the trend line :
(y - y1) = m(x - x1)
(1, 0.04) and slope (m) = 0.10
(y - 0.04) = 0.10(x - 1)
y - 0.04 = 0.10x - 0.10
y = 0.10x - 0.10 + 0.04
y = 0.10x - 0.06
Meaning of interpolation :
Interpolation is when we use the trend line to estimate a value that is already inside of our data set.
Meaning of extrapolation :
Extrapolation is when we use a trend line to estimate a value that is outside of the range of our data set.
d) When x = 6
y = 0.10(6) - 0.06
y = 0.6 - 0.06
y = 0.54
When x = 50
y = 0.10(50) - 0.06
y = 5 - 0.06
y = 4.94
Problem 2 :
Use the data in the table for

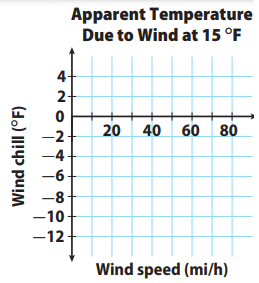
Make a scatter plot of the data and draw a trend line.
1) What type of association does the trend line show ?
2) Write an equation for your trend line.
3) Make a Prediction Use the trend line to predict the wind chill at these wind speeds.
a. 36 mi/h b. 100 mi/h
4) What is the meaning of the slope of the line?
Solution :
1)
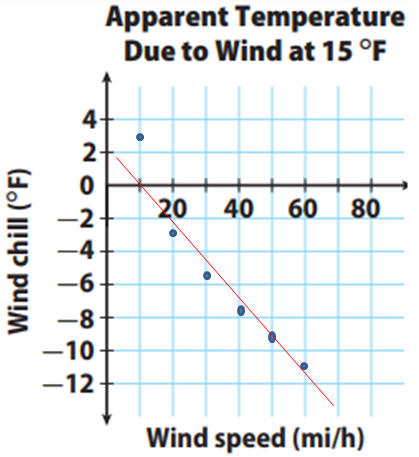
2) Choosing two points on the line, (50, -9.8) and (60, -11.4)
Slope = (-11.4 + 9.8) / (60 - 50)
= -1.6/10
= -0.16
= -16/100
Equation of the line :
(y - y1) = m(x - x1)
y + 9.8 = -0.16(x - 50)
y + 9.8 = -0.16x + 8
y = -0.16x + 8 - 9.8
y = -0.16x - 1.8
3)
|
Speed = 36 mi/h y = -0.16(36) - 1.8 y = -5.76 - 1.8 y = -7.56 |
Speed = 100 mi/h y = -0.16(100) - 1.8 y = 16 - 1.8 y = 14.2 |
4) Meaning of slope :
For every 100 miles, the temperature will reduce 16° F.
Problem 3 :
The scatter plot below shows data comparing wind speed and wind chill for an air temperature of 20 °F. Use the scatter plot
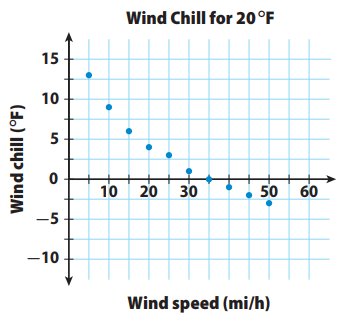
Draw a trend line for the scatter plot.
1) Write an equation for your trend line.
2) Use your equation to predict the wind chill to the nearest degree for a wind speed of 60 mi/h.
Solution :
1)
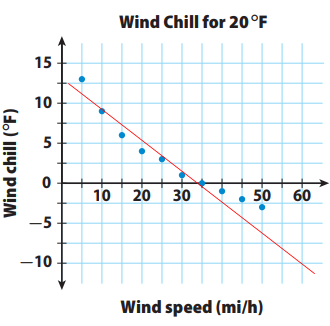
Equation of the trend line :
(10, 9) and (35, 0)
Slope (m) = (0 - 9) / (35 - 10)
= -9/25
2) Wind chill at 60 (mi/h) = -10° F.
Problem 4 :
The scatter plot and trend line show the relationship between the number of chapters and the total number of pages for several books. Write an equation for the trend line.
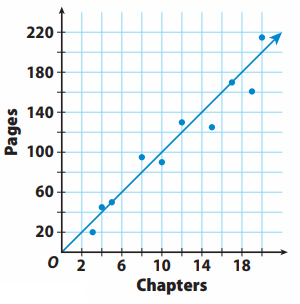
a) What type(s) of association does the scatter plot show?
b) What is the meaning of the slope in this situation?
c) What is the meaning of the y-intercept in this situation?
Solution :
Choosing two point on the line, (5, 50) and (17, 170)
Slope = (170 - 50) / (17 - 5)
= 120/12
= 10
Equation of the trend line :
y - 50 = 10(x - 5)
y - 50 = 10x - 50
y = 10x
a) Linear, positive
b) For every 1 book increases, the number of pages increases by 10.
c) y-intercept means, when x = 0.
0 books will have 0 pages.
Problem 5 :
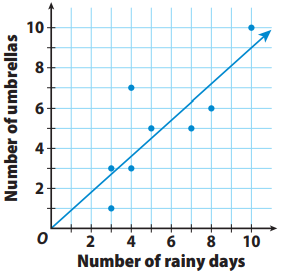
The scatter plot and trend line show the relationship between the number of rainy days in a month and the number of umbrellas sold each month. Write an equation for the trend line.
Solution :
Choosing two points (3, 1) and (5, 5)
Slope = (5 - 1) / (5 - 3)
= 4/2
= 2
Equation of the trend line :
y - 1 = 2(x - 3)
y = 2x - 6 + 1
y = 2x - 5
So, equation of the trend line is y = 2x - 5.
Subscribe to our ▶️ YouTube channel 🔴 for the latest videos, updates, and tips.
Recent Articles
-
Finding Range of Values Inequality Problems
May 21, 24 08:51 PM
Finding Range of Values Inequality Problems -
Solving Two Step Inequality Word Problems
May 21, 24 08:51 AM
Solving Two Step Inequality Word Problems -
Exponential Function Context and Data Modeling
May 20, 24 10:45 PM
Exponential Function Context and Data Modeling