INTERPRETING STEM AND LEAF PLOTS
A stem-and-leaf plot uses the digits of data values to organize a data set. Each data value is broken into a stem (digit or digits on the left) and a leaf (digit or digits on the right). A stem-and-leaf plot shows how data are distributed.
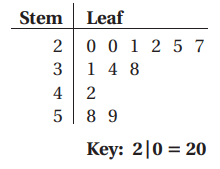
The key explains what the stem and leaf represents.
Problem 1 :
The stem-and-leaf plot shows student test scores.
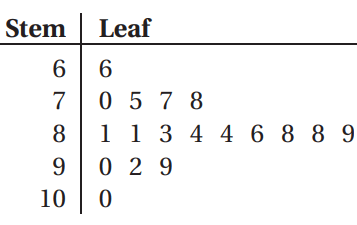
(a) How many students scored less than 80 points?
(b) How many students scored at least 90 points?
(c) How are the data distributed?
Solution :
a) 66, 70, 75, 77, 78 are the scores lesser than 80. So, 5 students has scored less than 80 points.
b) Atleast 90 means, the minimum is 90. More than 90 is also acceptable.
90, 92, 99 and 100
So, 4 students has scored at least 90.
c) The distribution is symmetric.
Problem 2 :
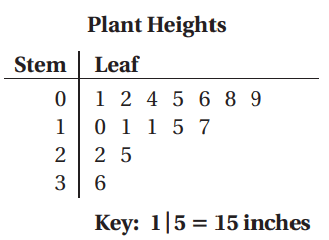
Which statement is not true?
A) Most of the plants are less than 20 inches tall.
B) The median plant height is 11 inches.
C) The range of the plant heights is 35 inches.
D) The plant height that occurs most often is 11 inches
Solution :
Listing out the values
1, 2, 4, 5, 6, 8, 9, 10, 11, 11, 15, 17, 22, 25, 36
Total number of data values = 15
Statement A :
Most of the data values are lesser than 22.
So, option A is correct.
Statement B :
Median = 16/2 ==> 8th value
Median = 10
So, option B is not correct.
Problem 3 :
Use the stem-and-leaf plot at the right.
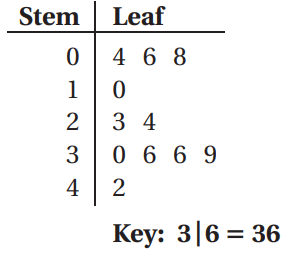
1. How many data values are in the set?
2. What is the least value? greatest value?
3. What is the median? range?
4. Is the value 32 in the set? Explain.
Solution :
1) There are 11 values in the data set.
2) Least value = 4 and greatest value = 42
3) Median = (11 + 1)/2
= 6th value
24 is the median.
Range = Greatest value - least value
= 42 - 4
= 38
4) 32 is not in the data set.
Problem 4 :
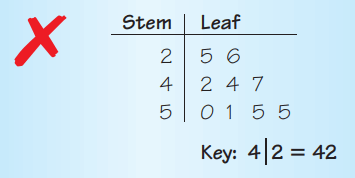
Describe and correct the error in making a stem-and-leaf plot of the data.
51, 25, 47, 42, 55, 26, 50, 44, 55
Solution :
51, 25, 47, 42, 55, 26, 50, 44, 55
Arranging the values from least to greatest.
25, 26, 42, 44, 47, 50, 51, 55, 55
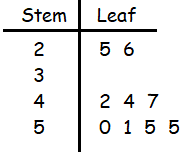
One more stem should be included. Then the corrected stem and leaf plot will be
Problem 5 :
The weights (in pounds) of eight puppies at a pet store are
12, 24, 17, 8, 18, 31, 24, and 15.
Make a stem-and-leaf plot of the data. Describe the distribution of the data.
Solution :
12, 24, 17, 8, 18, 31, 24, 15
Arranging the data values from least to greatest.
8, 12, 15, 17, 18, 24, 24, 31
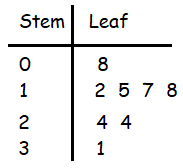
The least weight of the pet is 8 pounds. The distribution is symmetric.
Problem 6 :
The stem-and-leaf plot shows the number of digs for the top 15 volleyball players at a recent women’s AVP Miami Open.
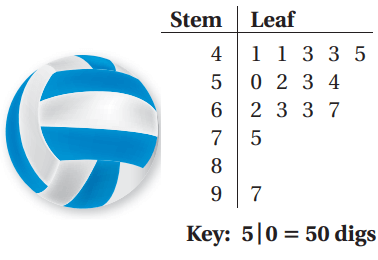
1. How many players had more than 60 digs?
2. Find the mean, median, mode, and range of the data.
3. Describe the distribution of the data.
4. Which data value is the outlier? Describe how the outlier affects the mean.
Solution :
Listing out the number of digs from least to greatest.
41, 41, 43, 43, 45, 50, 52, 53, 54, 62, 63, 63, 67, 75, 97
Number of values = 15
1) 6 players had more than 60 digs.
2) Mean :
Median = (15 + 1)/2 th value
= 8th value is the median.
53 is the median.
Mode :
Modes are 41, 43 and 63.
Range :
Range = Greatest value - least value
= 97 - 41
= 56 is the range.
3) The data is symmetric to the right.
4) Outlier is 97.
Problem 7 :
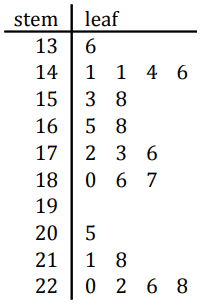
1. Determine the minimum value, maximum value and range of the data.
2. How many values are greater than 190?
3. Determine the count, median, mode and mean of the data. Round the mean to one decimal place if necessary
4. How many values are less than 151?
Solution :
1. Minimum value = 131 and maximum value = 228
2. 7 values are greater than 190.
3. Mean
(136+141+141+144+146+153+158+165+168+172+173+176+180+186+187+205+211+218+220+222+226+228)/22
= 179.8
Mode = 141
Range = 228-136
= 92
4. 5 values are lesser than 151.
Recent Articles
-
Finding Range of Values Inequality Problems
May 21, 24 08:51 PM
Finding Range of Values Inequality Problems -
Solving Two Step Inequality Word Problems
May 21, 24 08:51 AM
Solving Two Step Inequality Word Problems -
Exponential Function Context and Data Modeling
May 20, 24 10:45 PM
Exponential Function Context and Data Modeling