INTERPRETING SCATTER PLOTS
Problem 1 :
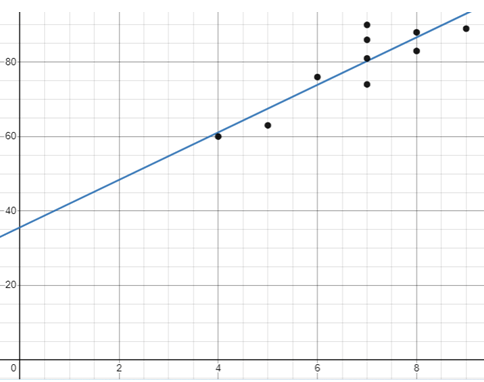
A history teacher asked her students how many hours of sleep they had the night before a test. The data below shows the number of hours the student slept and their score on the exam. Plot the data on a scatter plot.

Solution :
Problem 2 :
Assume that during a three hour period spent outside, a person recorded the temperature and water consumption. The experiment was conducted on 7 randomly selected days during the summer. This data is shown in the table below.
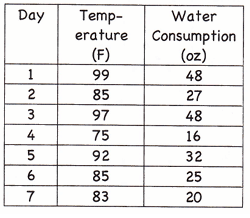
Create the scatter plot for the data. What is the correlation of the scatter plot ?
Solution :
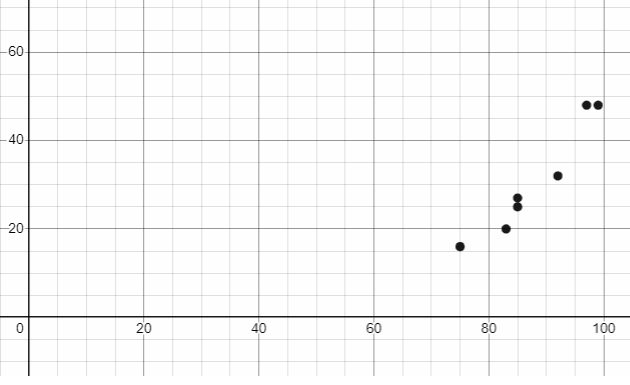
There is positive correlation between the above quantities.
Problem 3 :
The value of cars in a used car garage are recorded below. The scatter graph shows this information
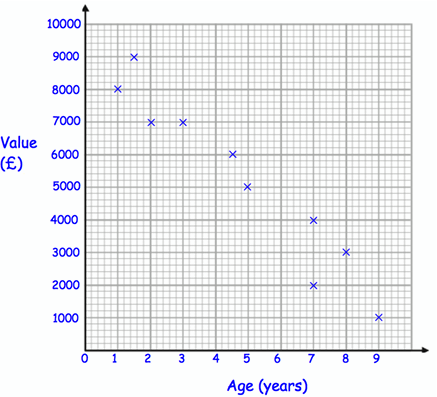
Another car arrives at the garage. It is 4 years old and worth £5000.
(a) Show this information on the scatter graph.
(b) Describe the correlation between the value of the car and the age of the car.
The next car that arrives is 6 years old.
(c) Estimate the value of the car.
Solution :
a)
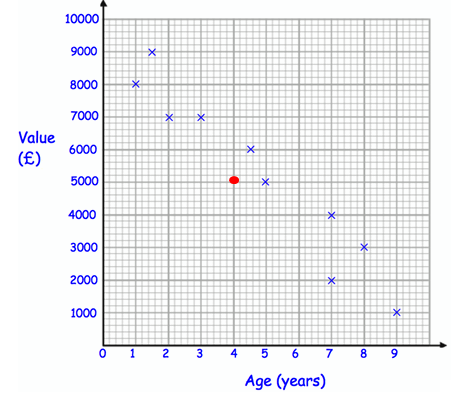
b) Type of correlation : negative correlation
To estimate the cost of car after 6 years, we have to draw the line of best fit.
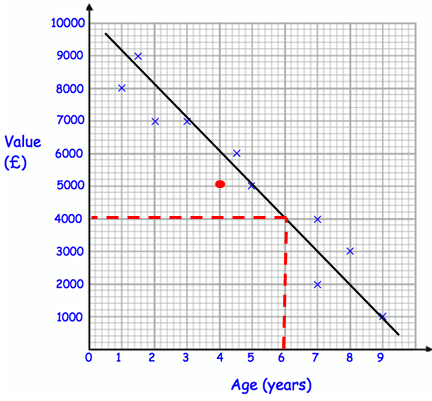
c) Cost of car after 6 years is 4000.
Problem 4 :
The table shows the time spent revising and the test scores of ten students.

(a) Complete the scatter diagram.
(b) Describe the relationship shown in the scatter diagram.
(c) Draw a line of best fit on your scatter diagram.
(d) Another student has spent 4.5 hours revising. Use your line of best fit to estimate their test result.
Solution :
a)
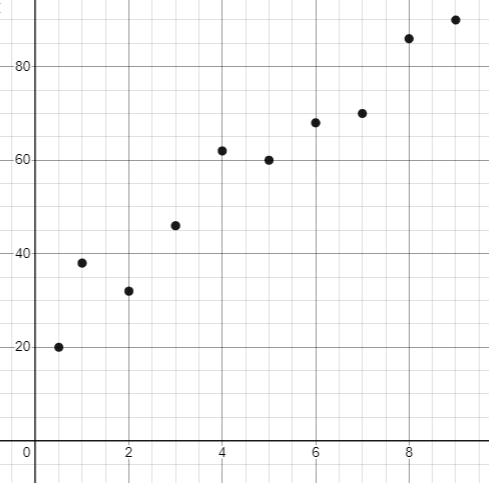
b) Time spent and test scores, they are in positive correlation.
c)
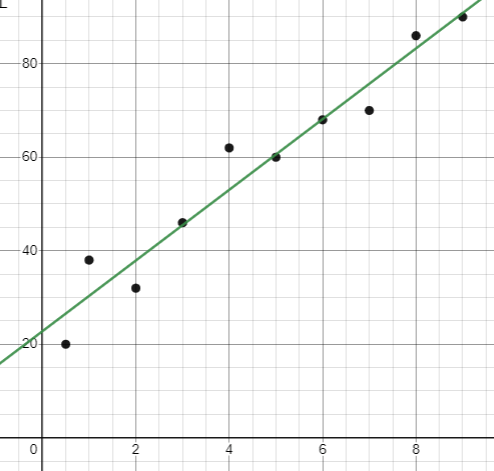
d)
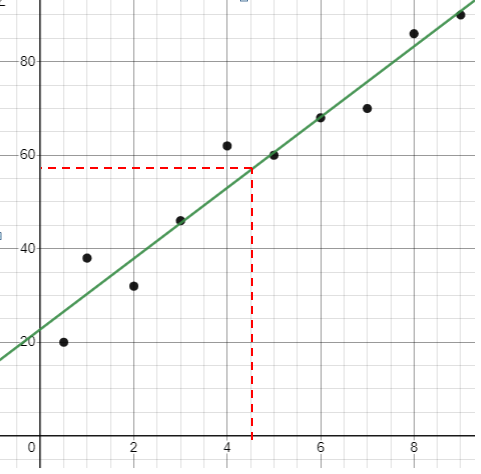
When the student is spending 4.5 hours for revising, he will score 57.
Problem 5 :
The table shows the charge (£) by plumbers for jobs of different duration (hours).

a) Plot the data on the scatter graph
b) Describe the correlation.
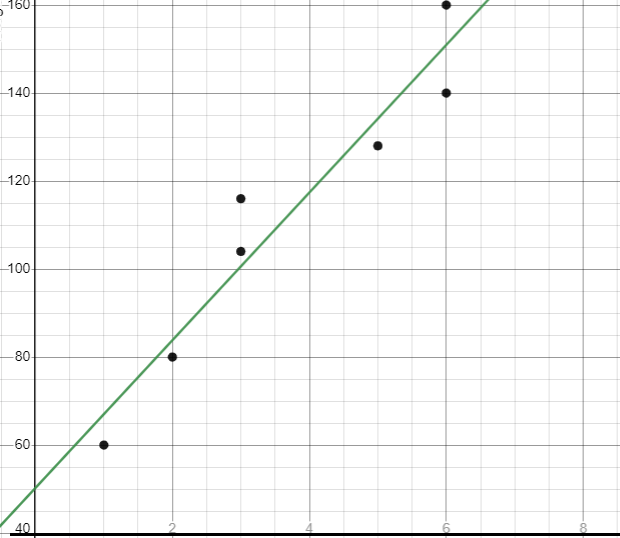
c) Draw a line of best fit on the scatter graph.
d) Use your line of best fit to estimate the charge for a 4 hour job.
(e) Explain why it may not be appropriate to use your line of best fit to estimate the charge for a job lasting 12 hours.
Solution :
a)
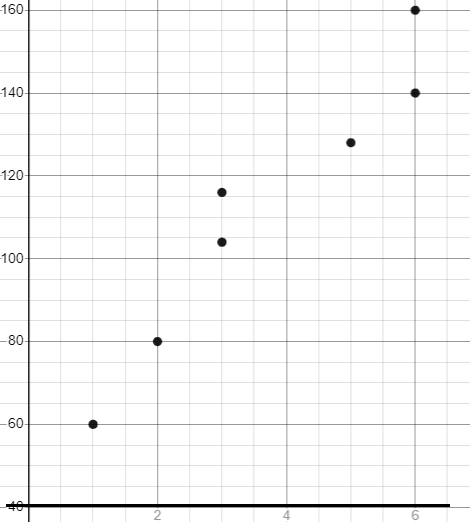
b) Type of correlation : Positive correlation.
c)
d)
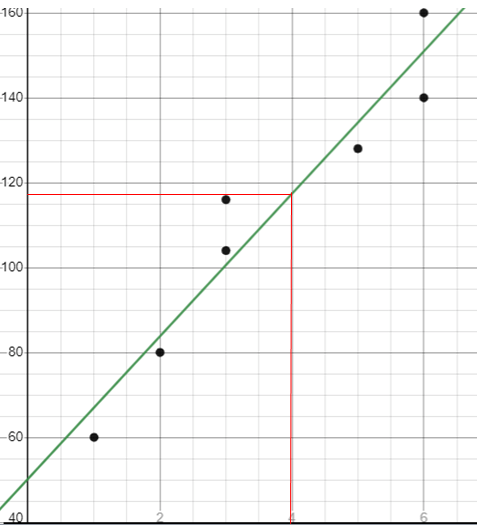
For 4 hours job, he will get the pay of 118.
e) When x = 12, we have to find the value of y. It is beyond the range, the estimation will not be appropriate.
Problem 6 :
Some rugby players take two tests, one measuring speed and the other measuring strength. Each test is marked out of 200. The scatter graph compares the results.
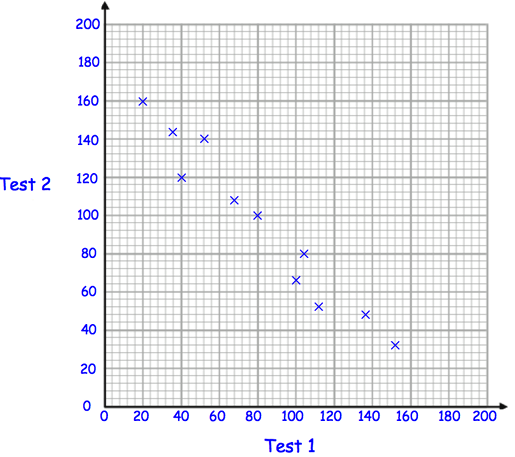
(a) What type of correlation does this scatter graph show?
(b) Draw a line of best fit on the scatter graph.
Brian scores 40 in Test 2.
(c) Estimate his score in Test 1.
Solution :
a) By observing the spread, when score of test 1 increases test score 2 decreases. We can draw a falling line as a line of best fit. It will have negative slope. So, negative correlation is there in between the variables.
b)
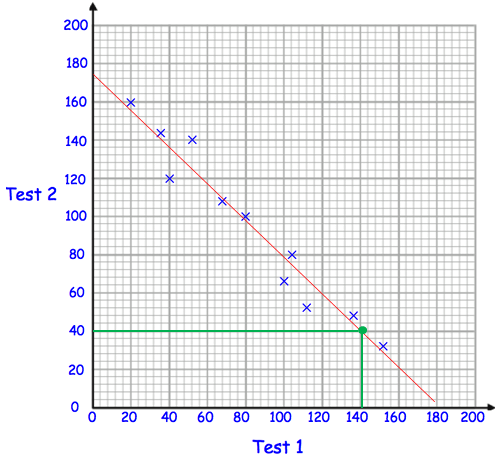
c) From the above line of best fit, when Brain scores 40 in Test 2, he may scored 140 in Test 1.
Problem 7 :
A shop sells umbrellas. The scatter graph shows information about the number of umbrellas sold each week and the rainfall that week, in millimetres.
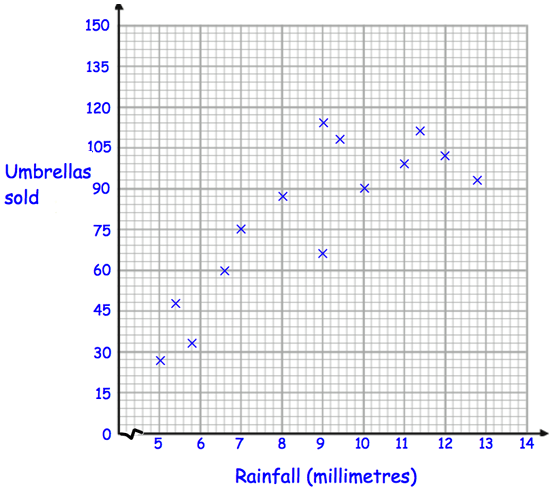
(a) Describe the relationship between the rainfall and umbrellas sold.
(b) What is the most number of umbrellas sold in one week?
(c) What is the greatest amount of rainfall in one week?
(d) In how many weeks did the shop sell over 105 umbrellas?
In another week, there was 6mm of rain.
(e) Estimate the number of umbrellas sold
(f) Explain why it may not be appropriate to use your line of best fit to estimate the number of umbrellas sold in a week with 25mm of rainfall.
Solution :
a) When rainfall increases the number of umbrellas sold also increases. So, it is a positive correlation.
b) 116 is the greatest number of umbrellas sold out in that week.
c) 13 mm is the greatest amount of rain fall.
d)
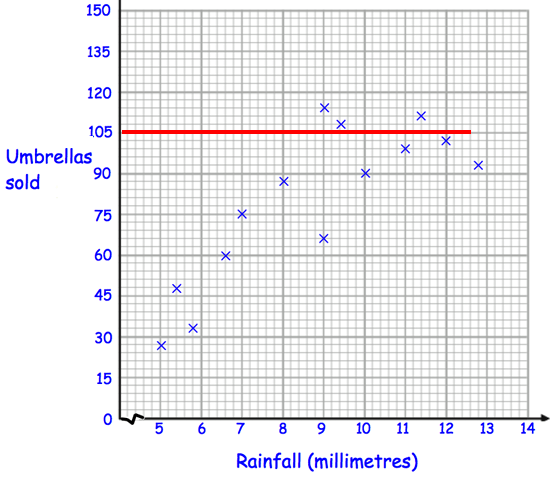
By drawing the horizontal line, we get 3 quantities which is above the horizontal line. So, 3 weeks is the answer.
In another week, there was 6 mm of rain.
(e) Estimate the number of umbrellas sold
(f) Explain why it may not be appropriate to use your line of best fit to estimate the number of umbrellas sold in a week with 25mm of rainfall.
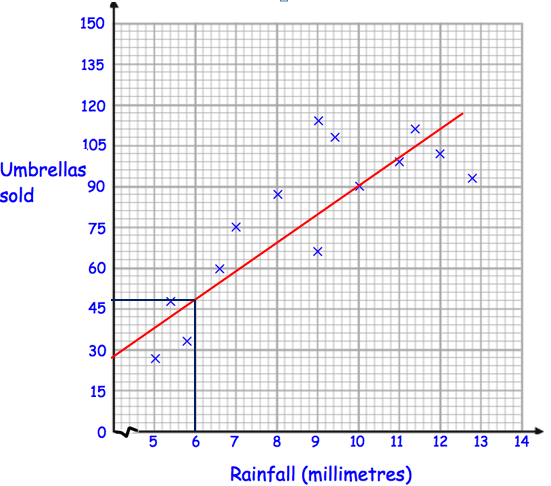
When the rainfall is 6 mm, there were 47 umbrellas sold.
f) 25 mm is beyond the range, so this estimation may not be appropriate.
Recent Articles
-
Finding Range of Values Inequality Problems
May 21, 24 08:51 PM
Finding Range of Values Inequality Problems -
Solving Two Step Inequality Word Problems
May 21, 24 08:51 AM
Solving Two Step Inequality Word Problems -
Exponential Function Context and Data Modeling
May 20, 24 10:45 PM
Exponential Function Context and Data Modeling