INTERPRETING LINE OF BEST FIT
Subscribe to our ▶️ YouTube channel 🔴 for the latest videos, updates, and tips.
The 'line of best fit' is a line that goes roughly through the middle of all the scatter points on a graph.
The closer the points are to the line of best fit the stronger the correlation is.
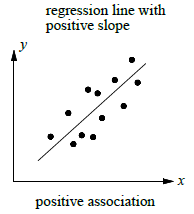
If the slope of a regression line is positive, then the two variables have a positive association.
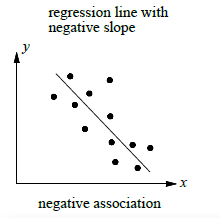
If the slope of regression line is negative , then the two variables have a negative association.
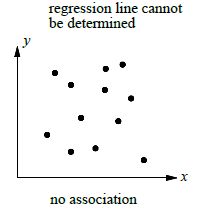
If the slope of regression line cannot be determined, then the two variables have no association.
Problem 1 :
A fifth grade class conducted a 5 minute experiment that involved heating time and water temperature. The results of the experiment are represented in the line graph below.
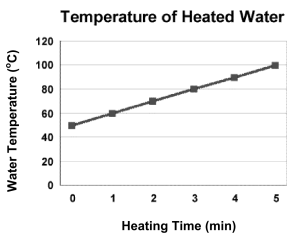
What prediction can be made based on the information gathered ?
a) The water temperature remains the same as the heating time continues.
b) The water temperature decreases as the heating time continues.
c) A pattern cannot be determined between these measurements.
d) The water temperature increases as the heating time continues.
Solution :
x-coordinate ==> Heating time
y-coordinate ==> Water temperature
The line of best fit is raising line, it has positive slope. So, positive association is there in between two quantities.
Water temperature increases as the heating time continues. So, option d is correct.
Problem 2 :
The table shows the number of students on a basket ball team and the number of free shows each student made during practice.
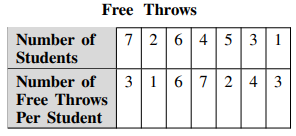
The coordinate grid below can be used to help answer the question.
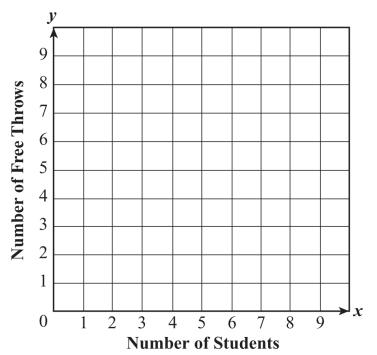
Based on this information, which best describes the relationship between the number of students and the number of free throws each student made.
a) Positive linear b) No relationship c) Negative linear
d) Quadratic
Solution :
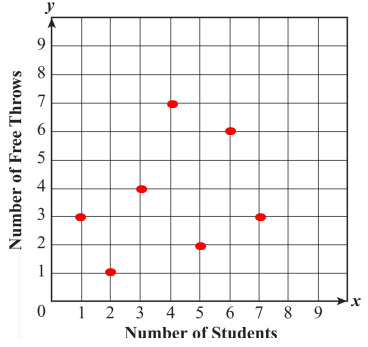
By observing the spread above, we understand that there is no relationship.
Problem 3 :
Which graph shows a line of best fit for the scatterplot?


Solution :
So, option c is correct.
Problem 4 :
For which scatter plot would the line of best fit be represented by the equation y = (1/2) x + 2 ?

Solution :
By observing the spread, the line of best fit will be
- option A represents the raising line
- option B represents the falling line
- option C represents the horizontal line
- option D represents the falling line
Taking the given equation, slope = 1/2 (positive)
Raising line will have positive slope, so option A is correct.
Problem 5 :
The researcher gathered data to predict the number of new types of plants (y) that will be in a state park after x years. After making a scatter plot of the data she determined the equation of the line of the best fit. The equation is shown below,
y = 0.25x + 8
Based on the equation, what is the number of new types of plants that will be in the park after 24 years ?
a) 8 b) 14 c) 32 d) 64
Solution :
Number of new plants after 24 years,
x = 24
y = 0.25(24) + 8
y = 6 + 8
y = 14
So, option b is correct.
Problem 6 :
A group of friends recorded the time it took to ride their bikes around the park. The scatter plot below shows their results with the line of best fit.

Using the line of best fit, which is closest to the number of minutes it would take to complete 9 laps ?
a) 4 b) 5 c) 6 d) 7
Solution :
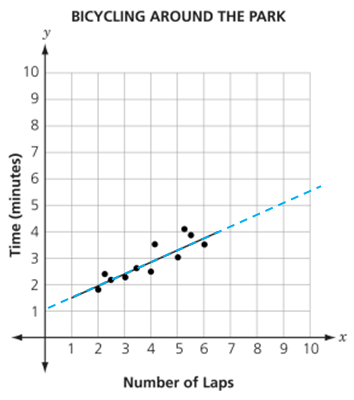
By extending the line, we get the answer 5.
Problem 7 :
Use the scatter plot to answer the question.

Oren plants a new vegetable garden each year for 14 years. This scatter plot shows her relationship between the number of seeds he plants and the number of plants that grow. Which number best represents the slope of the line of best fit through the data ?
a) -10 b) -1/10 c) 1/10 d) 10
Solution :
Drawing the line of best fit, it must be a raising line.
By observing Options a and b, they are negative slope. Choosing two points, (100, 23) and (200, 29)
Slope = (29 - 23) / (200 - 100)
= 6/100
= 3/10
Accordingly options given, option c is correct.
Problem 8 :
Use the graph below the answer the following question.

Which equation could describe the line of best fit for the graph above ?
a) y = 5x + 236 b) y = -5x + 236
c) y = (1/5)x + 236 d) y = (-1/5)x + 236
Solution :
Choosing two point from the scatter plot and finding slope, we get
(1, 240) and (5, 260)
Slope = (260 - 240) / (5 - 1)
= 20/4
= 5
By observing the options, y-intercept is 236. So, the required equation will be
y = 5x + 236.
Option a is correct.
Problem 9 :
The scatter plot below shows the relationship between the length of a long distance phone call and the cost of the phone call.
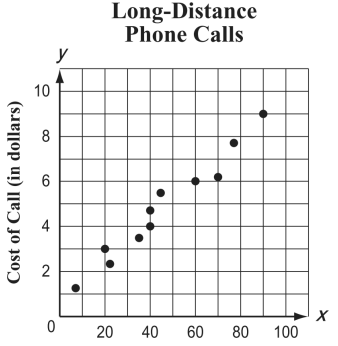
Based on the line of best fit for the scatter plot, which of the following amounts is closet to the cost of 120 minute phone call ?
a) $10 b) $12 c) $15 d) $20
Solution :

From the line of best fit, it is clear $12 is the answer.
Subscribe to our ▶️ YouTube channel 🔴 for the latest videos, updates, and tips.
Recent Articles
-
Finding Range of Values Inequality Problems
May 21, 24 08:51 PM
Finding Range of Values Inequality Problems -
Solving Two Step Inequality Word Problems
May 21, 24 08:51 AM
Solving Two Step Inequality Word Problems -
Exponential Function Context and Data Modeling
May 20, 24 10:45 PM
Exponential Function Context and Data Modeling