INTERPRETING DOT PLOTS WORKSHEET
Problem 1 :
At recess time the sales of drinks were recorded over a three minute period.
O = 100 plus, S = soy milk, C = cola, I = iced tea.
The data was : OSSCI OCISO IOCSO OOOSC SOCOS SOOCO OIOIS
a) Draw a dot plot of the data
b) What is the mode?
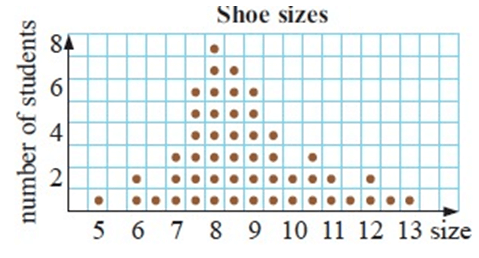
Problem 2 :
The dot plot shows shoe sizes for students in grade 6.
a) How many students are in grade 6 at this school?
b) How many have shoe size 9 or more?
c) what percentage have shoe sizes 8 or more?
Problem 3 :
The dot plot shows the numbers of students playing various instruments in the school orchestra.
a) How many play stringed instruments?
b) How many students are in the orchestra?
c) Find the mode of the data.
Problem 4 :
A class of students at a school in England were asked which summer sport they wanted to play. The choices were : T = tennis, S = swimming, C = cricket, B = basketball and F = football.
The data was : FFCTC CSFST TTBFS FFCSF TFTBC
a) Draw a horizontal dot plot of the data.
b) Find the mode of the data.
Problem 5 :
Students voted the most popular attractions at the local show to be the side shows (S), the farm animals (F), the ring events (R), the dogs and cats (D), and the wood chopping (W). The students in a class were then asked to name their favorite.
The data was : SRWSS WFDDS RRFWS RSRWS SRRRF
a) Draw a horizontal dot plot of the data.
b) Find the mode of the data.
Answer Key
1)
a)
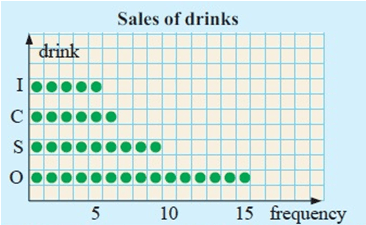
b) 100 plus.
2) a) 50 students b) 22 shoe sizes c) 74%
3) a) 12 b) 28 students c) Violin
4) a)
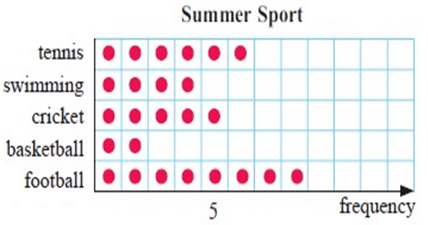
b) Foot ball
5) a)
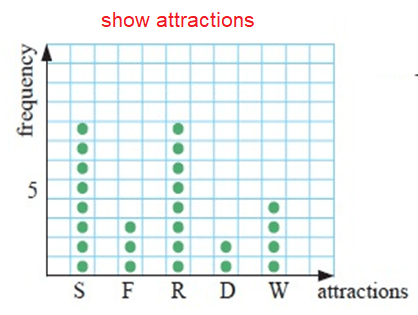
b) Side shows and ring events are mode.
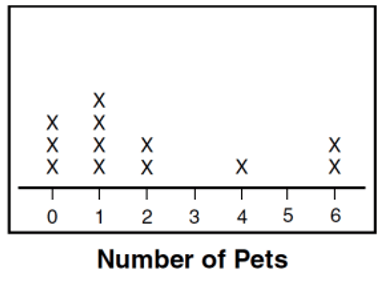
Problem 1 :
Use the line plot. Find the
(i) Mean (ii) Median (iii) Mode and (iv) Range
of the data.
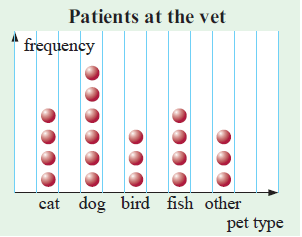
Problem 2 :
The dot plot shows the types of pets treated at a vet on one day.
a) How many pets were treated on this day?
b) Find the mode of the data.
c) What percentage of the pets treated were fish?
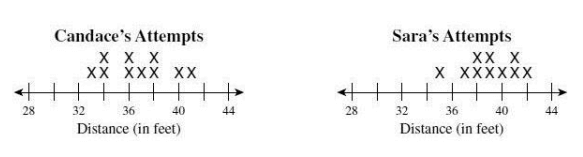
Problem 3 :
Four girls on a high school track and field team practice the shot put. Each girl made 10 attempts, and the distances measure after each attempt are shown on the plots below.
a) Which girl’s range of distance was the greatest?
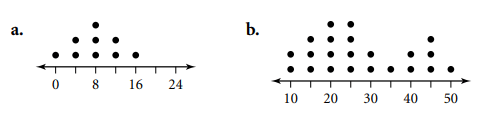
Problem 4 :
Find the mean, median, and mode of each dot plot.
Recent Articles
-
Finding Range of Values Inequality Problems
May 21, 24 08:51 PM
Finding Range of Values Inequality Problems -
Solving Two Step Inequality Word Problems
May 21, 24 08:51 AM
Solving Two Step Inequality Word Problems -
Exponential Function Context and Data Modeling
May 20, 24 10:45 PM
Exponential Function Context and Data Modeling