INTERPRETING BOX AND WHISKER PLOTS WORKSHEET
Problem 1 :
The accompanying box and whisker plot represents the cost, in dollars of the twelve CD's ?
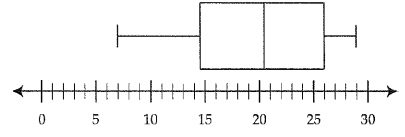
1) What is the upper quartile ?
2) What is the range of the costs of the CD's ?
3) What is the median ?
4) Which cost represents the 100th percentile ?
5) How many CD's cost between $14.50 and $26.00 ?
6) How many CD's cost less than $14.50 ?
Problem 2 :
What is the median price for a snowboard at Middle snow boards ?
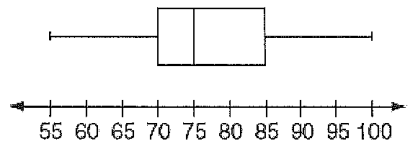
1) What is the median score ?
a) 70 b) 75 c) 77 d) 85
2) What is the interquartile range ?
Problem 3 :
What is the value of the third quartile shown on the box and whisker plot below ?

a) 6 b) 10 c) 8.5 d) 12
Problem 4 :
A movie theater recorded the number of tickets sold daily for a popular movie during the month of June. The box and whisker plot shown below represents the data for the number of tickets sold, in hundreds.

Which conclusion can be made using this plot ?
a) The second quartile is 600.
b) The mean of the attendance is 400.
c) The range of the attendance is 300 to 600.
d) 25% of the attendance is between 300 and 400.
Problem 5 :
The accompanying box and whisker plots can be used to compare the annual incomes of three professions.
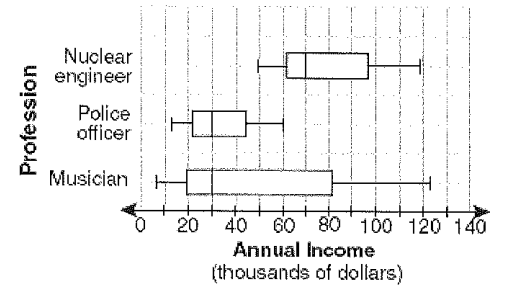
Based on the box and whisker plots, which statement is true ?
a) The median income of nuclear engineers is greater than the income of all musicians.
b) The median income for police officers and musicians is the same.
c) All nuclear engineers earn more than all police officers.
d) A musician will eventually earn more than a police officer.
Problem 6 :
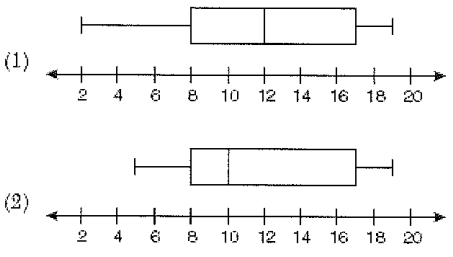
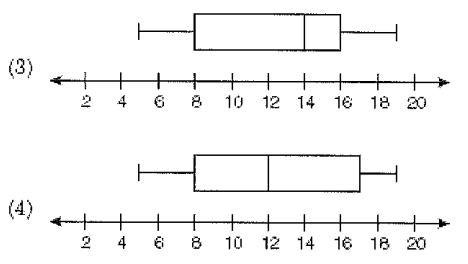
The data set 5, 6, 7, 8, 9, 9, 9, 10, 12, 14, 17, 17, 18, 19, 19 represents the number of hours spent on the internet in a week by students in mathematics class. Which box and whisker plot represents the data ?
Problem 7 :
Using the plot given below, find
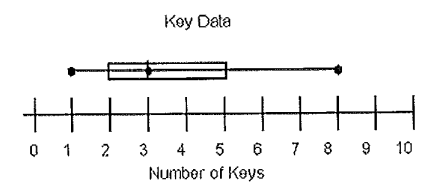
1) Range
2) IQR
3) Percent more than 5
4) Percent at least 2
5) If there are 32 numbers in the data set, how many are less than 3 ?
Problem 8 :
Using the plot given below, find

the percentage of data values less than 7.
Recent Articles
-
Finding Range of Values Inequality Problems
May 21, 24 08:51 PM
Finding Range of Values Inequality Problems -
Solving Two Step Inequality Word Problems
May 21, 24 08:51 AM
Solving Two Step Inequality Word Problems -
Exponential Function Context and Data Modeling
May 20, 24 10:45 PM
Exponential Function Context and Data Modeling