INTERPRETATION OF BAR GRAPH
Subscribe to our ▶️ YouTube channel 🔴 for the latest videos, updates, and tips.
Problem 1 :
A manager surveys his employees to find out how they travel to work
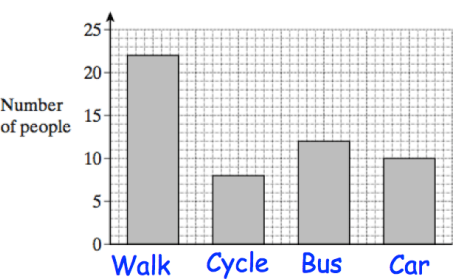
(a) What is the least popular method of transport?
(b) What is the most popular method of transport?
(c) Calculate the total number of employees
Solution :
a) Cycle is the least popular method of transport.
b) Most popular method of transport is walk.
c) Total number of employees = 22 + 8 + 12 + 11
= 53
Problem 2 :
The weights of four athletes are displayed below.
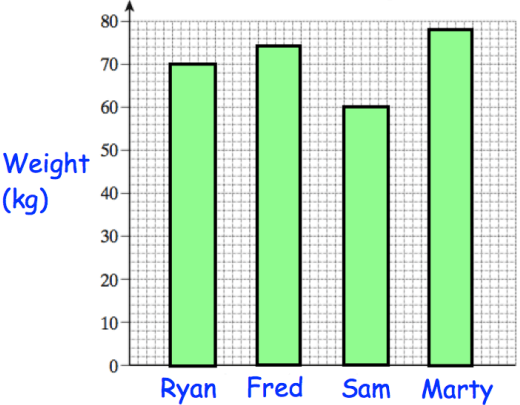
(a) Who is the lightest athlete?
(b) Write down Martyʼs weight. .............................kg
(c) Work out the range of the weights
Solution :
a) Sam is the lightest athlete
b) 78 kg
c) Highest weight = 78, least weight = 58
Range = 78 - 58
= 20 kg
Problem 3 :
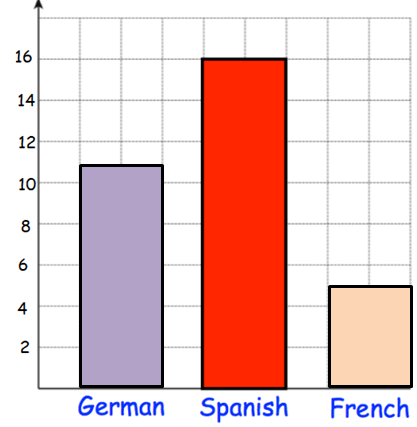
Miss Jackson asked the 32 students in her tutor group which language they study. Each student studies one language only.
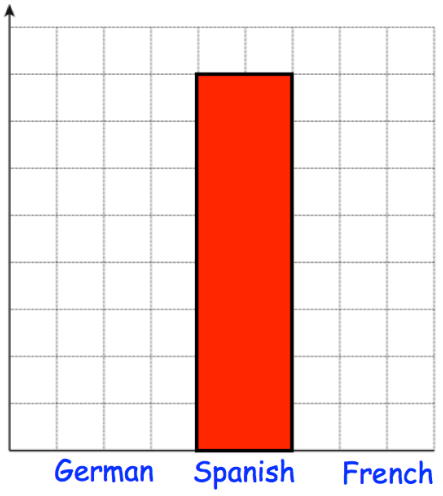
Half of the students in the tutor group study Spanish. Six more students study German than French. Complete the bar chart.
Solution :
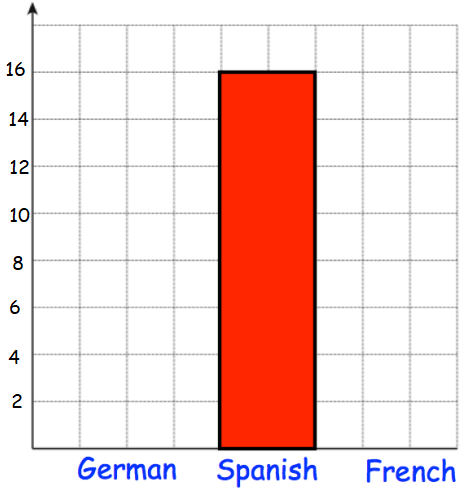
Total number of students = 32
Half of the student who study Spanish = 32/2 = 16
Let x be the number of students who study French.
Number of students who study German = x + 6
x + 6 + 16 + x = 32
2x + 22 = 32
2x = 10
x = 5
German = 5 + 6 ==> 11
French = 5
Problem 3 :
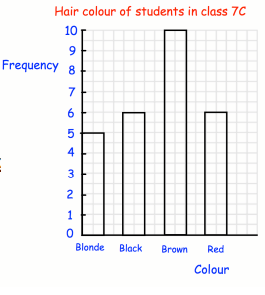
The bar chart shows information about the hair colour of students in 7C.
(a) What is the most common hair colour in 7C?
(b) How many students had black hair?
(c) What hair colour is the least popular in 7C?
(d) How many more students had brown than red hair?
(e) How many students are in 7C?
Solution :
(a) Brown is the most common hair colour in 7C.
(b) 6 students had black hair?
(c) Blonde is the least popular in 7C.
(d) 6 students had brown than red hair?
(e) Total number of students = 5 + 6 + 10 + 6
= 31 students
Problem 4 :
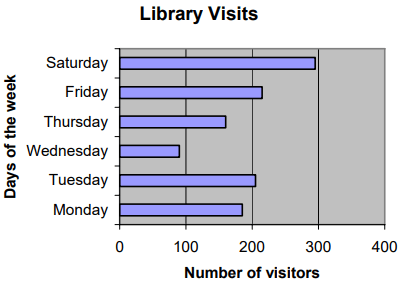
1. On which day did the library receive the most visitors?
2. Approximately how many visitors came to the library that day?
3. It is because of weekend.
4. Approximately 170 visitors has came to the library on Monday.
5. From Wednesday to Saturday the number of visitors were increased.
Solution :
1. On Saturday the library had received the most visitors.
2. Approximately 290 visitors has came to the library that day.
3. Why do you think that day had the most visitors?
4. Approximately how many visitors came to the library on Monday?
5. Describe the pattern you see in the number of visitors from Wednesday to Saturday.
Problem 5 :
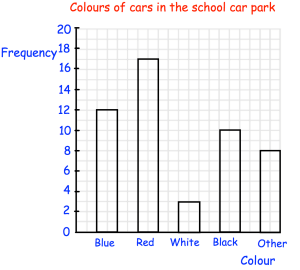
Nicole recorded the colours of cars in a car park She then drew a bar chart to show the results.
(a) What is the most common colour of car?
(b) How many cars were blue?
(c) How many cars were white?
(d) How many more cars were red than black?
(e) Why do you think there is a bar called “other?”
(f) How many cars were in the car park?
Solution :
(a) The most common colour is red.
(b) 12 cars were blue.
(c) There were 3 white cars.
(d) There are 2 more red cars than black?
(e) The number of cars other than the colours blue, red, white and black. That is called other.
(f) Total number of cars = 12 + 17 + 3 + 10 + 8
= 50
So, total number of cars is 50.
Subscribe to our ▶️ YouTube channel 🔴 for the latest videos, updates, and tips.
Recent Articles
-
Finding Range of Values Inequality Problems
May 21, 24 08:51 PM
Finding Range of Values Inequality Problems -
Solving Two Step Inequality Word Problems
May 21, 24 08:51 AM
Solving Two Step Inequality Word Problems -
Exponential Function Context and Data Modeling
May 20, 24 10:45 PM
Exponential Function Context and Data Modeling