HOW TO SKETCH THE DERIVATIVE OF A GRAPH WITHOUT THE FUNCTION
Subscribe to our ▶️ YouTube channel 🔴 for the latest videos, updates, and tips.
Details to be Noted from Original function
- If f(x) is increasing on the particular interval, then f'(x) will be above the x-axis.
- If f(x) is decreasing on the particular interval, then f'(x) will be below the x-axis.
- Critical points of the original function will be x-intercepts of derivative function.
- In other words, the maximum and minimum of f(x) will be x-intercepts of f'(x).
To draw the graph of the derivative function, we may follow the procedure given below.
- Mark the increasing and decreasing interval from the function f(x).
- Mark the maximum and minimum from the graph.
Relationship Between Graph of Original Function and Derivative
|
Original graph Linear Quadratic Cubic Quartic Exponential Logarithmic sin cosine |
Graph of derivative Horizontal line Linear Quadratic Cubic Exponential Rational cosine sin |
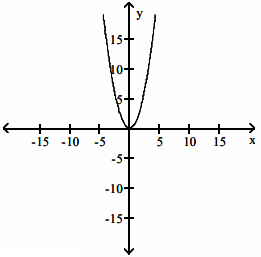
Graph of the function is given, Choose the answer that represents the derivative.
Problem 1 :
Solution :
Finding increasing and decreasing interval :
- On (-∞, 0) the function f(x) is decreasing.
- On (0, ∞) the function f(x) is increasing.
- It has relative minimum at (0, 0)
Graph of derivative :
- The derivative function will be above the x-axis on (-∞, 0)
- The derivative function will be below the x-axis on (0, ∞).
- The relative minimum will be the x-intercept.
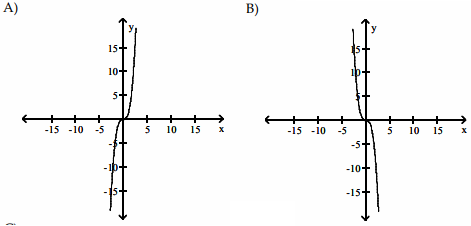
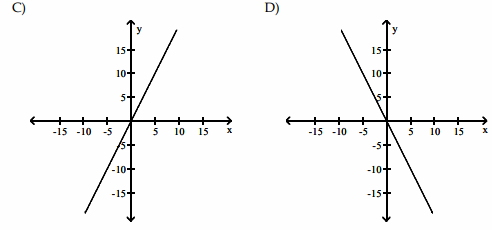
Since the given function is quadratic, its derivative graph must be a linear.
So, considering options C and D,
|
option C : (-∞, 0) --> Below the x-axis. (0, ∞) --> above the x-axis. It contradicts |
option D : (-∞, 0) --> above the x-axis. (0, ∞) --> below the x-axis. So, answer is option D. |
Problem 2 :
If a function f is continuous for all x and if f has a relative maximum at (-1, 4) and a relative minimum at (3, -2) , which of the following statements must be true?
(A) The graph of f has a point of inflection somewhere between x = -1 and x = 3.
(B) f '(-1) = 0
(C) The graph of f has a horizontal asymptote.
(D) The graph of f has a horizontal tangent line at x = 3
(E) The graph of f intersects both axes.
Solution :
Option A :
We may find points of inflection when concavity changes. If the curve changes its direction from increasing to decreasing, we may find maximum and if the curve changes its direction from decreasing to increasing then we may find minimum. From the given information, it is clear that we have maximum and minimum. Surely there will be changes in concavity. So, option A is true.
Option B :
At maximum and minimum point, we can draw the horizontal tangent lines. So, option B is true.
Option C :
It is not true.
Option D :
At x = 3, we have relative minimum. So, there must be horizontal tangent line.
Option E :
If the function f is continuous for all x, it means that the graph of f will intersect both axes at some point. This is because if a function is continuous, it means that there are no breaks or jumps in the graph, so it must cross the x-axis (y = 0) and the y-axis (x = 0) at least once.
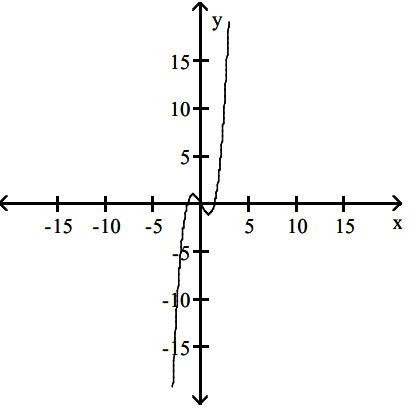
Graph of the function is given, Choose the answer that represents the derivative.
Problem 3 :
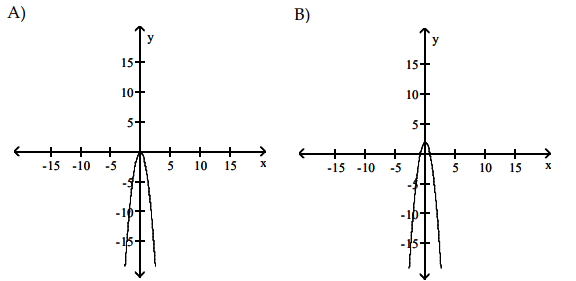
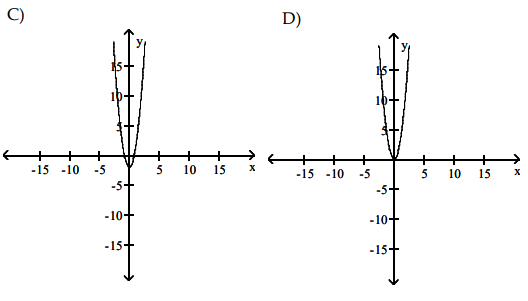
Solution :
Finding increasing and decreasing interval :
- On (-∞, -1) the function f(x) is increasing.
- On (-1, 1) the function f(x) is decreasing.
- On (1, ∞) the function f(x) is increasing.
- It has relative maximum at x = -1 and minimum at x = 1.
Graph of derivative :
- The derivative function will be above the x-axis on (-∞, -1)
- The derivative function will be below the x-axis on (-1, 1)
- The derivative function will be above the x-axis on (1, ∞)
- At x = -1 and 1, there will be x-intercepts.
Since the given function is a cubic, its derivative graph must be a quadratic. All the options are graph of quadratic function.
Option C :
- (-∞, -1) --> it is above the x-axis
- (-1, 1) --> it is below the x-axis
- (1, ∞) --> it is above the x-axis
- (-1, 0)(1, 0) are x-intercepts.
So, option C is correct.
Problem 4 :
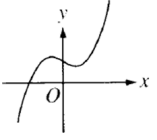
The graph y = h(x) is shown above. Which of the following could be the graph of y = h'(x)?
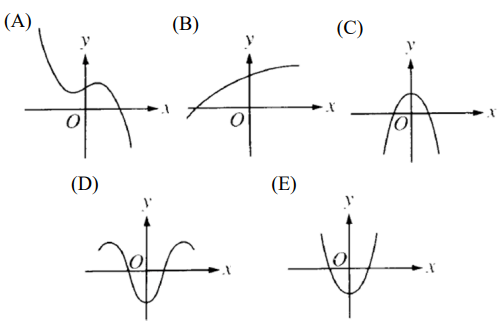
Finding increasing and decreasing interval :
- Approximately on (-∞, -2) the function f(x) is increasing.
- On (-2, 1) the function f(x) is decreasing.
- On (1, ∞) the function f(x) is increasing.
- It has relative maximum at x = -1 and minimum at x = 1.
Graph of derivative :
- The derivative function will be above the x-axis on (-∞, -2)
- The derivative function will be below the x-axis on (-2, 1)
- The derivative function will be above the x-axis on (1, ∞)
- At x = -2 and x = 1, there is relative maximum and minimum respectively.
So, option E is correct.
Problem 5 :
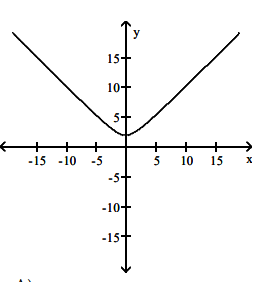
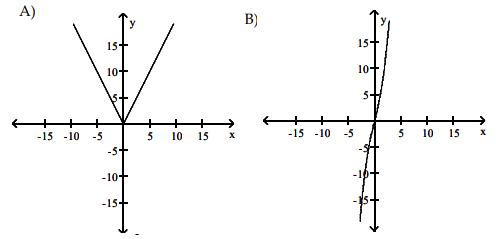
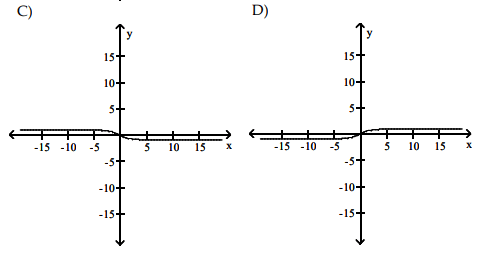
Solution :
Finding increasing and decreasing interval :
- On (-∞, 0) the function f(x) is decreasing.
- On (0, ∞) the function f(x) is increasing.
- At x = 0 there is minimum.
Graph of derivative :
- The derivative function will be below the x-axis on (-∞, 0)
- The derivative function will be above the x-axis on (0, ∞)
S, option D is correct.
Subscribe to our ▶️ YouTube channel 🔴 for the latest videos, updates, and tips.
Recent Articles
-
Finding Range of Values Inequality Problems
May 21, 24 08:51 PM
Finding Range of Values Inequality Problems -
Solving Two Step Inequality Word Problems
May 21, 24 08:51 AM
Solving Two Step Inequality Word Problems -
Exponential Function Context and Data Modeling
May 20, 24 10:45 PM
Exponential Function Context and Data Modeling