HOW TO INTERPRET SCATTER PLOT WITH REGRESSION LINE
Subscribe to our ▶️ YouTube channel 🔴 for the latest videos, updates, and tips.
Regression line is a straight line, which estimates the relationship between the variables involving in the problem.
The other name of regression line is line of best fit. Regression line or line of best fit may be raising line or falling line.
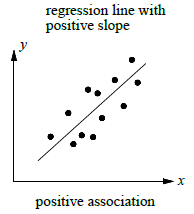
If the slope of a regression line is positive, then the two variables have a positive correlation.
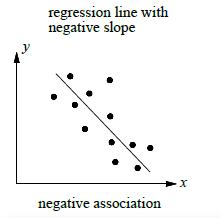
If the slope of regression line is negative , then the two variables have a negative correlation.
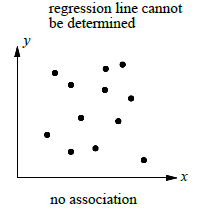
If the slope of regression line cannot be determined, then the two variables have no correlation.
Problem 1 :
A fifth grade class conducted a 5 minute experiment that involved heating time and water temperature. The results of the experiment are represented in the graph below.
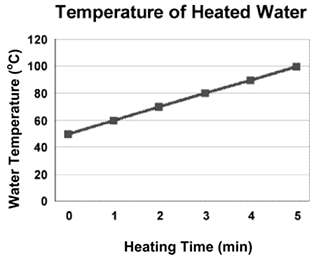
What prediction can be made based on the information gathered ?
a) The water temperature remains the same as the heating time continues.
b) The water temperature decreases as the heating time continues.
c) A pattern cannot be determined between these measurements
d) The water temperature increases as the heating time continues.
Solution :
By observing the line of best fit, it is raising line. This will have positive slope.
x - axis ==> heating time
y - axis ==> Water temperature
When heating time increases water temperature will also increase.
Answer is Option d :
The water temperature increases as the heating time continues.
Problem 2 :
A group of friends recorded the time it took to ride their bikes around the park. The scatter plot below shows their results with the line of best fit
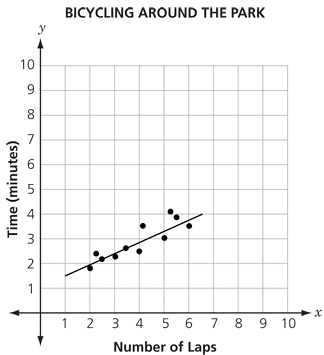
Using the line of best fit, which is the closest to be the number of minutes would take to complete 9 laps?
a) 4 b) 5 c) 6 d) 7
Solution :
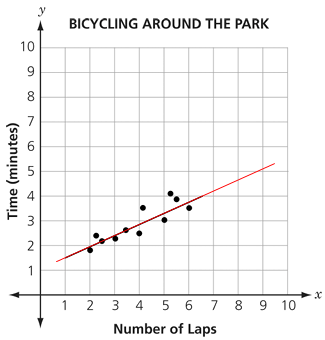
Continuing the line of best fit, he will take 5 minutes for 9 laps.
Problem 3 :
A carpenter recorded the amount of money he earned for different jobs and the amount of time he spent in each job. The data are shown in the scatter plot below. Based on the data, which best represents the amount of money the carpenter would earn from a job that took 5 days to complete ?
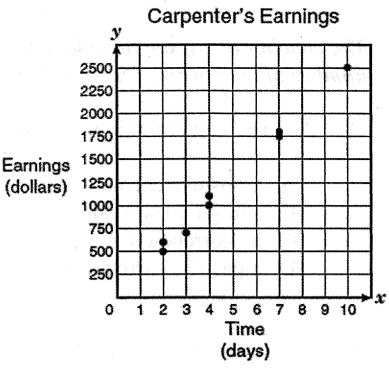
a) 2500 b) 500 c) 1250 d) 200
Solution :
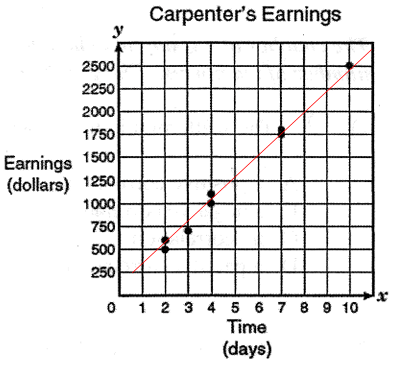
By drawing a line of best fit, the estimated earning for 5 days is 1250.
Problem 4 :
use the table below, which shows the median salary for women who had completed a college degree for the years 19891998.
|
Year 1989 1990 1991 1992 1993 1994 1995 1996 1997 1998 |
Salary in thousands of dollars 42 43 45 46 48 49 50 51 53 57 |
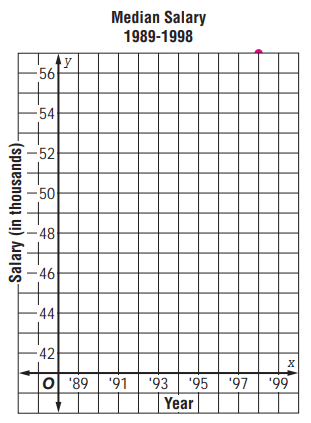
a) Does there appear to be a relationship between year and salary?
b) Based on the graph, predict what the median salary was for the year 2000
Solution :
a) Yes, there is a relationship between year and salary.
b)
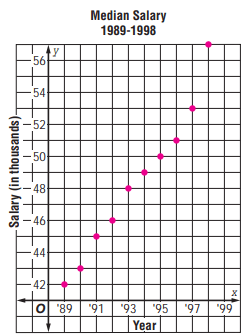
Median salary in the year 2000 is at least 60,000
Problem 5 :
The scatter plot compares the weights and heights of the players on a high school football team
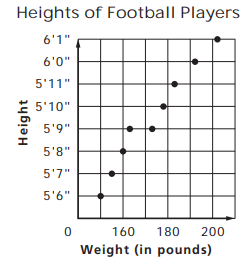
a) What type of relationship exists, if any?
b) Based on the scatter plot, predict the weight of a 5'50'' player who decided to join the team.
Solution :
a) In general, as the heights of the players increase, so do the weights. The scatter plot shows a positive relationship.
b) approximately 145 pounds
Problem 6 :
Scientists have determined that there may be a relationship between temperature and the number of chirps produced by crickets. The table gives the temperature and the number of chirps per minute for several cricket samples.
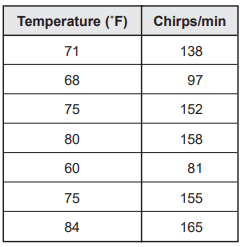
a) Make a scatter plot of the data.
b) Does there appear to be a relationship between temperature and chirps? Explain.
c) Suppose the outside temperature is 65 degree. About how many chirps per minute would you expect from a cricket?
d) Suppose the outside temperature is 55 degree. About how many chirps per minute would you expect from a cricket?
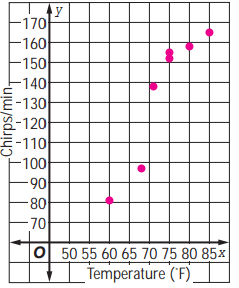
b) Yes, as temperature increases, chirps/min increase indicating a positive relationship.
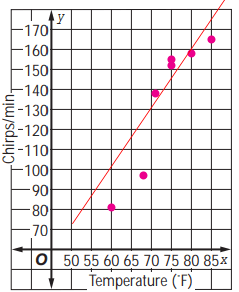
c) approximately 115 chirps
d) approximately 85 chirps
Subscribe to our ▶️ YouTube channel 🔴 for the latest videos, updates, and tips.
Recent Articles
-
Finding Range of Values Inequality Problems
May 21, 24 08:51 PM
Finding Range of Values Inequality Problems -
Solving Two Step Inequality Word Problems
May 21, 24 08:51 AM
Solving Two Step Inequality Word Problems -
Exponential Function Context and Data Modeling
May 20, 24 10:45 PM
Exponential Function Context and Data Modeling