HOW TO FIND MEAN MEDIAN AND MODE ON A DOT PLOT
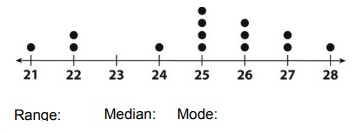
Find the mean, median, mode values for each dot plot.
Problem 1 :

Solution:
Values = 21, 22, 22, 24, 25, 25, 25, 25, 26, 26, 26, 27, 27, 28
Range:
To find the range, read the least and greatest values from the dot plot. Subtract the least value from the greatest.
28 - 21 = 7
Median:
Mode:
In the data, given the value 25 appears more number of times, that is 4 times.
So, mode = 25
Problem 2 :

Solution:
Values = 0.11, 0.11, 0.11, 0.12, 0.12, 0.12, 0.13, 0.13, 0.14, 0.15, 0.15, 0.15, 0.15, 0.15, 0.16, 0.16, 0.16, 0.16, 0.16, 0.17, 0.17, 0.18, 0.18
Range:
To find the range, read the least and greatest values from the dot plot. Subtract the least value from the greatest.
0.18 - 0.11 = 0.7
Median:
Total number of value = 23
= (23+1)/2 th value
= 12th value will be median.
Observing the dot plot, 0.15 is the median.
Mode:
In the data, given the value 0.15, 0.16 appears more number of times, that is 5 times.
So, mode = 0.15, 0.16
Problem 3 :

1. How do the ranges compare?
2. Compare the number of elements.
3. How do the modes compare?
4. How do the medians compare?
5. Describe the distribution of the dots in each plot.
Solution:
1. Range:
Plot A : 24 - 21 = 3
Plot B : 24 - 21 = 3
Ranges are equal.
2. Number of elements:
Plot A : 7
Plot B : 9
Number of elements are different.
3. Modes:
Plot A : 21
Plot B : 23, 24
4. Median:
Total number of values in plot A = 7. Then, 4th value will be median.
Plot A : 21
Total number of values in plot B = 9. Then, 5th value will be median.
Plot B : 23
Median of plot B is greater than plot A.
Recent Articles
-
Finding Range of Values Inequality Problems
May 21, 24 08:51 PM
Finding Range of Values Inequality Problems -
Solving Two Step Inequality Word Problems
May 21, 24 08:51 AM
Solving Two Step Inequality Word Problems -
Exponential Function Context and Data Modeling
May 20, 24 10:45 PM
Exponential Function Context and Data Modeling