HOW TO FIND MEAN AND STANDARD DEVIATION FROM BAR GRAPH
Subscribe to our ▶️ YouTube channel 🔴 for the latest videos, updates, and tips.
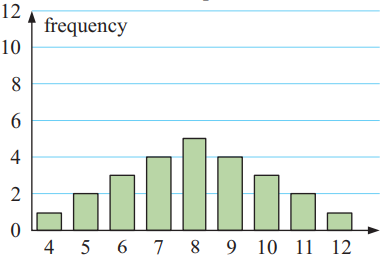
Find the mean and standard deviation from the bar graph given below.
Problem 1 :
Solution :
By observing the above bar graph, it is clear that
|
Values 4 5 6 7 8 9 10 11 12 |
Frequency 1 2 3 4 5 4 3 2 1 |
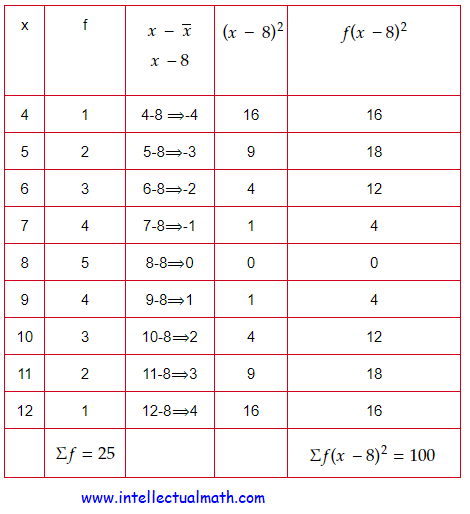
The required,
mean = 8
and
standard deviation = 2
Problem 2 :
Solution :
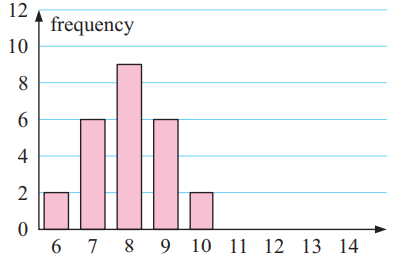
By observing the above bar graph, it is clear that
|
Values 6 7 8 9 10 |
Frequency 2 6 9 6 2 |
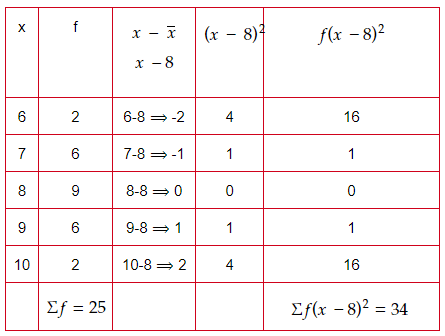
The required,
mean = 8
and
standard deviation = 1.16
Problem 3 :
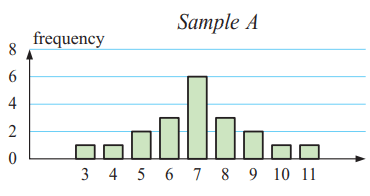
Solution :
By observing the above bar graph, it is clear that
|
Values(x) 3 4 5 6 7 8 9 10 11 |
Frequency (f) 1 1 2 3 6 3 2 1 1 |
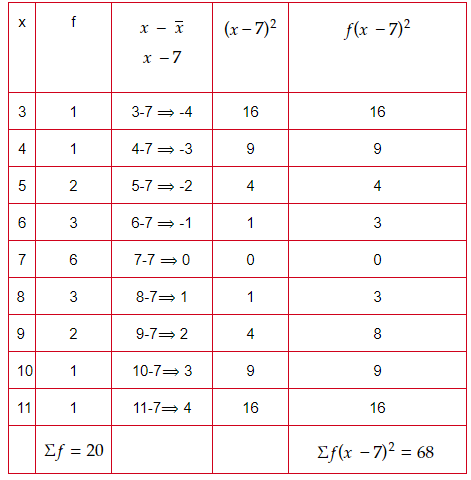
The required,
mean = 7
and
standard deviation = 1.84
Problem 4 :
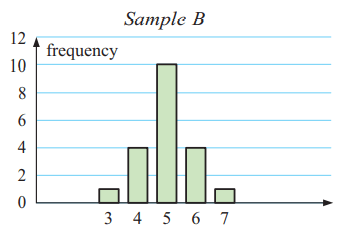
Solution :
By observing the above bar graph, it is clear that
|
Values (x) 3 4 5 6 7 |
Frequency (f) 1 4 10 4 1 |
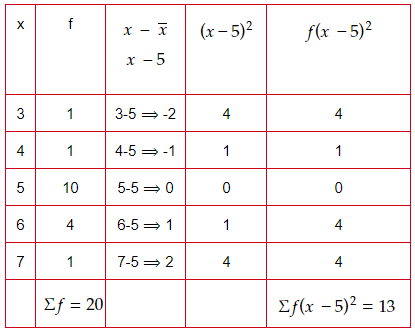
The required,
mean = 13
and
standard deviation = 0.80
Problem 5 :
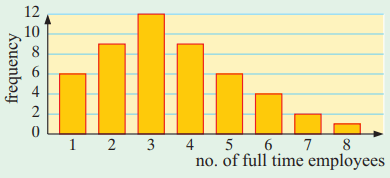
Solution :
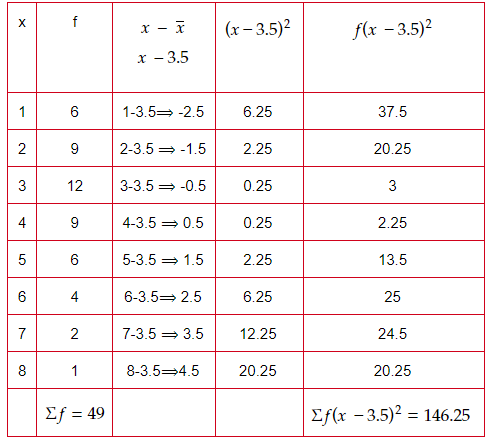
By observing the above bar graph, it is clear that
|
Number of employees (x) 1 2 3 4 5 6 7 8 |
Frequency (f) 6 9 12 9 6 4 2 1 |
Subscribe to our ▶️ YouTube channel 🔴 for the latest videos, updates, and tips.
Recent Articles
-
Finding Range of Values Inequality Problems
May 21, 24 08:51 PM
Finding Range of Values Inequality Problems -
Solving Two Step Inequality Word Problems
May 21, 24 08:51 AM
Solving Two Step Inequality Word Problems -
Exponential Function Context and Data Modeling
May 20, 24 10:45 PM
Exponential Function Context and Data Modeling