HOW TO FIND AVERAGE RATE OF CHANGE OVER AN INTERVAL FROM A GRAPH
Subscribe to our ▶️ YouTube channel 🔴 for the latest videos, updates, and tips.
Definition of average rate of change :
The average rate of change between x = a and x = b is the slope of the secant line of the curve between the points x = a and x = b
Step 1 :
Consider the given values as a and b.
Step 2 :
By tracing the curve find the respective output for x = a and x = b.
Step 3 :
Consider the outputs as f(a) and f(b).
Step 4 :
Use the formula provided and find the average rate of change.
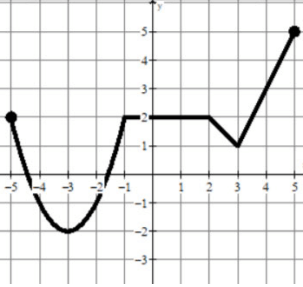
Use the following graph to find the average rate of change of the given interval.

Problem 1 :
Find the average rate of change in the interval
-5 ≤ x ≤ -2
Solution :
Let a = -5 and b = -2
- Tracing the curve at x = -5, we get one of the point on the curve (-5, 2).
- Tracing the curve at x = -2, we get one of the point on the curve (-2, -1).
f(a) = f(-5) = 2 and f(b) = f(-2) = -1
Problem 2 :
Find the average rate of change in the interval
[-1, 5]
Solution :
Let a = -1 and b = 5
- Tracing the curve at x = -1, we get one of the point on the curve (-1, 2).
- Tracing the curve at x = 5, we get one of the point on the curve (5, 5).
f(a) = f(-1) = 2 and f(b) = f(5) = 5
Problem 3 :
Find the average rate of change in the interval
-4 ≤ x ≤ -2
Solution :
Let a = -4 and b = -2
- Tracing the curve at x = -4, we get one of the point on the curve (-4, -1).
- Tracing the curve at x = -2, we get one of the point on the curve (-2, -1).
f(a) = f(-4) = -1 and f(b) = f(-2) = -1
Problem 4 :
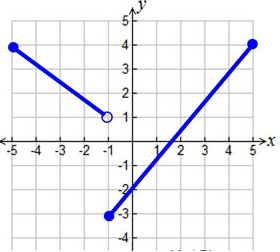
Regarding the graph at the right, what is the average rate of change over the interval -1 < x < 5 ?

Solution :
Let a = -1, b = 5
f(a) = f(-1) = -3 and f(b) = f(5) = 4
Problem 5 :
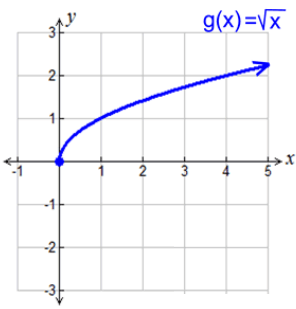
Find the average rate of change between x = 0 and x = 4

Solution :
Let a = 0, b = 4
f(a) = f(0) = √0 = 0
and
f(b) = f(4) = √4 = 2
Subscribe to our ▶️ YouTube channel 🔴 for the latest videos, updates, and tips.
Recent Articles
-
Finding Range of Values Inequality Problems
May 21, 24 08:51 PM
Finding Range of Values Inequality Problems -
Solving Two Step Inequality Word Problems
May 21, 24 08:51 AM
Solving Two Step Inequality Word Problems -
Exponential Function Context and Data Modeling
May 20, 24 10:45 PM
Exponential Function Context and Data Modeling