HOW TO DRAW A LINE GRAPH
Definition of line graph :
A line graph is a graph that is used to display change over time as a series of data points connected by straight line segments on two axes.
Problem 1 :
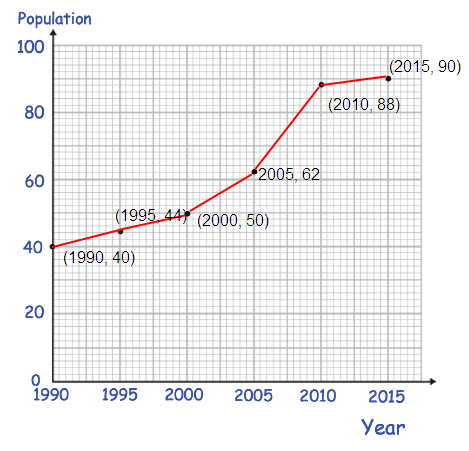
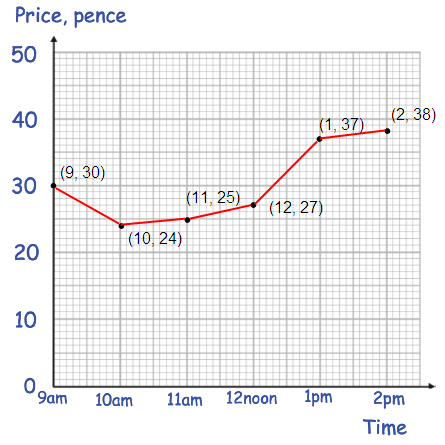
Draw a line graph for each of the following tables.
(a)
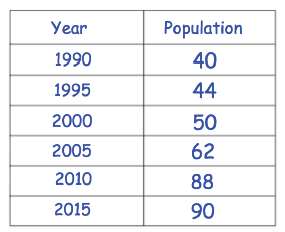
Solution :
Problem 2 :
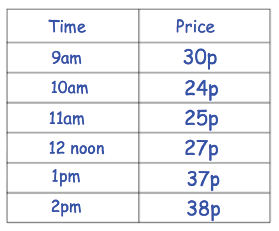
Solution :
Problem 3 :
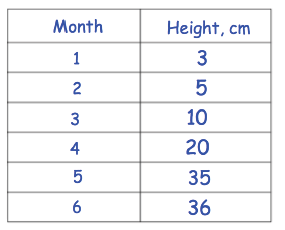
Solution :
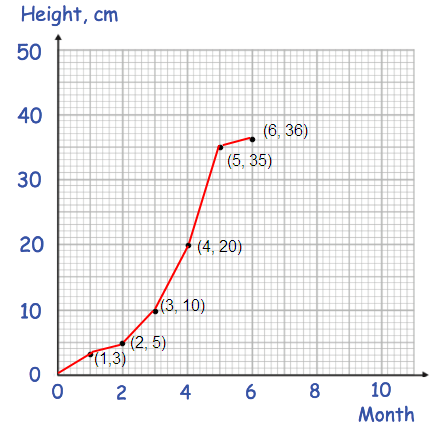
Problem 4 :
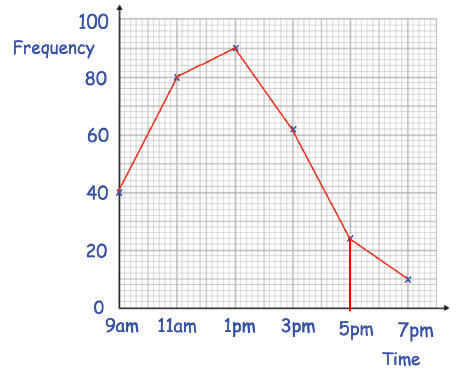
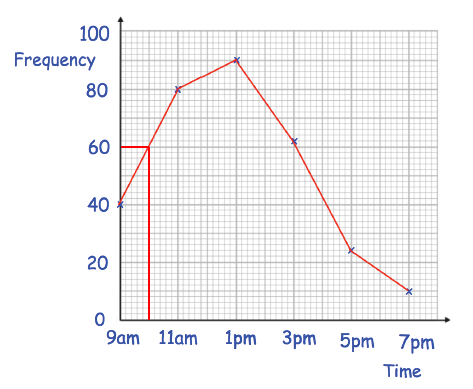
Sally recorded the number of cars in a car park every two hours.
She begun at 9am and finished at 7 pm.
The line graph shows her results.
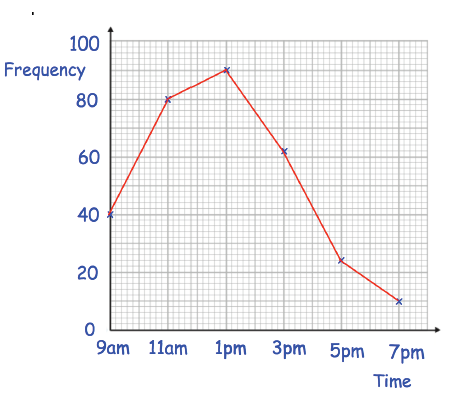
(a) When were the most cars in the car park ?
(b) How many cars were in the car park at 11 am
(c) At what time were there 24 cars in the car park ?
(d) Estimate the number of cars in the car park at 10 am.
(e) How many less cars were in the car park at 3 pm than 1 pm ?
Solution :
(a) At 1 pm most number of cars where in the car park.
(b) 80 cars were in the car park at 11 am.
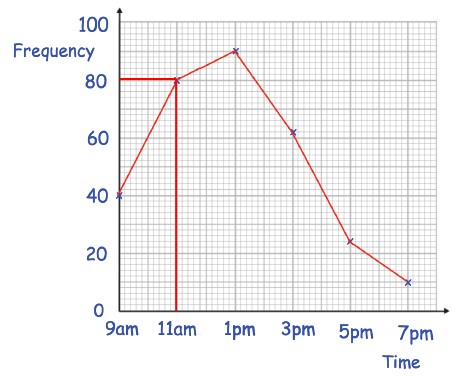
(c) 24 cars in the car park at 5 pm.
(d) 60 cars in the car park at 10 am.
(e)
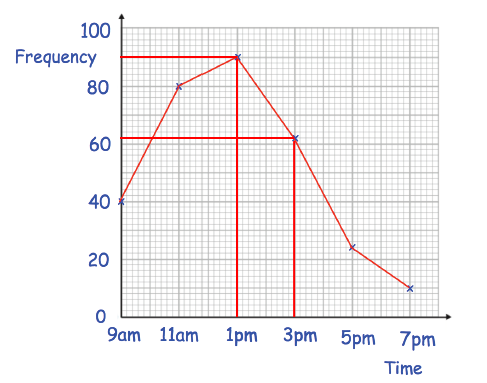
3pm = 62
1pm = 90
difference = 90 - 62
= 28 less cars
Problem 3 :
The line graph below shows the cost of a coffee in a shop over 30 years.
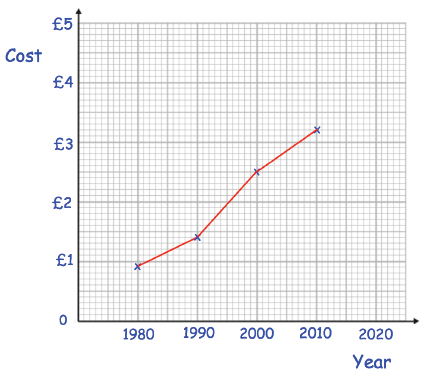
(a) In which year was the price £2.50 ?
(b) How much was the price of a coffee in 1990 ?
(c) Estimate the price of a coffee in 2005.
Carlos says that the price of a coffee will be £3.60 by 2020.
(d) Do you agree with Carlos ? Explain your answer.
Solution :
(a)
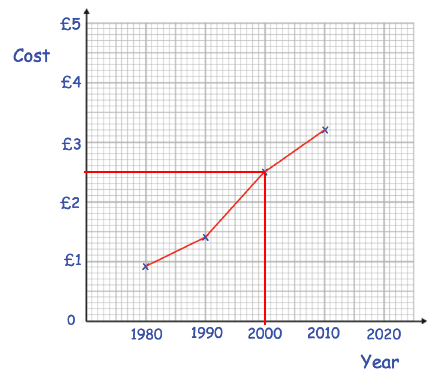
In the year 2000, the price is £2.50.
(b)
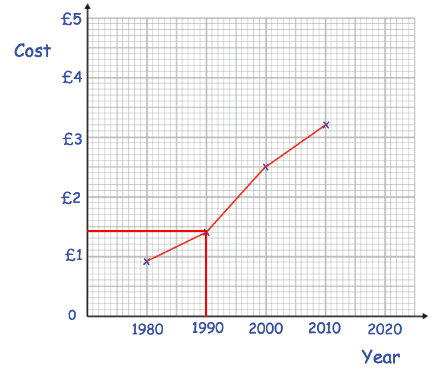
The price of a coffee in 1990 is £1.4.
(c) The price of a coffee in 2005 is 2.85.
(d) Yes, i agree with Carlos. If we extend line from 2010 to 2020, the corresponding cost will be £3.6.
Problem 4 :
The table below shows the average temperature in Belfast and Plymouth.
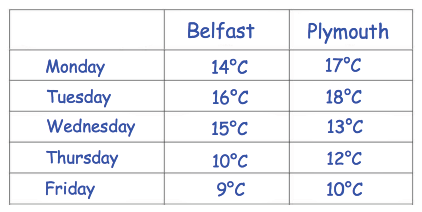
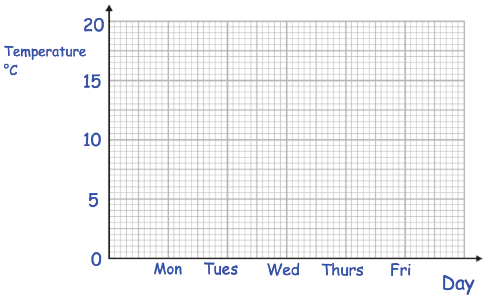
(a) Draw line graphs on the same axes to show the temperature in Belfast and Plymouth.
(b) On which day did Belfast have a higher temperature than Plymouth ?
(c) Between which two consecutive days did the temperature in Belfast change the most ?
Solution :
(a)
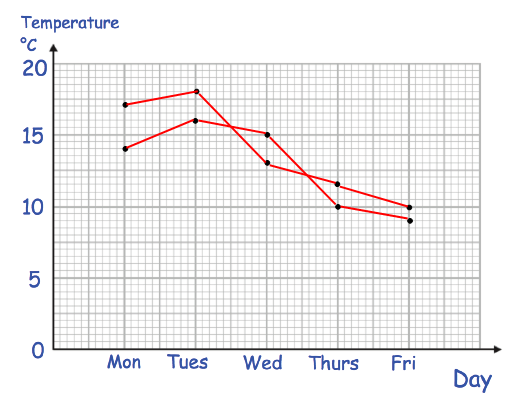
(b) Tuesday belfast have a higher temperature than Plymouth.
(c) Two consecutive days : Tuesday and wednesday.
Recent Articles
-
Finding Range of Values Inequality Problems
May 21, 24 08:51 PM
Finding Range of Values Inequality Problems -
Solving Two Step Inequality Word Problems
May 21, 24 08:51 AM
Solving Two Step Inequality Word Problems -
Exponential Function Context and Data Modeling
May 20, 24 10:45 PM
Exponential Function Context and Data Modeling