GRAPHS OF PROPORTIONAL RELATIONSHIPS
Subscribe to our ▶️ YouTube channel 🔴 for the latest videos, updates, and tips.
Problem 1 :
Olivia sold water bottles over four days. Create a graph to determine if the quantities of bottles and number of days are proportional. If the quantities are proportional, what is the constant of proportionality ?

Solution :
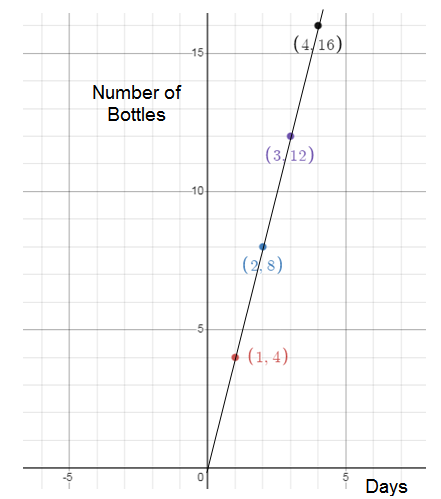
From the graph it is clear.
The table represents proportional between quantities of bottles and number of days.
Number of days = x, Number of bottles = y
y = kx
k = y/x
k = 4/1
k = 4
So, the constant of proportionality (k) is 4.
Problem 2 :
Aiden brought some pencils and boxes. Create a graph to determine if the quantities of boxes and pencils are proportional. If the quantities are proportional, what is the constant of proportionality ?

Solution :
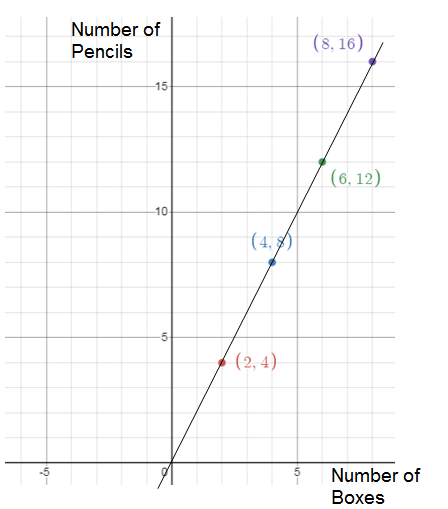
The table represents proportional between quantities of boxes and number of pencils.
Number of boxes = x, number of pencils = y
y = kx
k = y/x
k = 4/2
k = 2
So, the constant of proportionality (k) is 2.
Problem 3 :
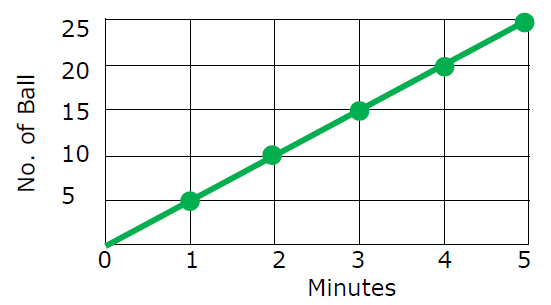
The graph below represents the number of balls thrown over time. What is the constant of proportionality ?
Solution :
The graph represents proportional between number of balls and minutes.
Number of Minutes = x
Number of Balls = y
y = kx
k = y/x
k = 5/1
k = 5
So, the constant of proportionality (k) is 5.
Problem 4 :
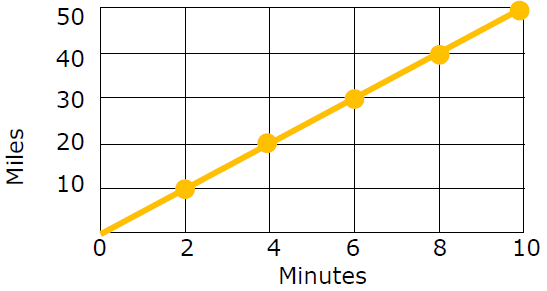
The graph below represents the number of miles Michael ran over time. What is the constant of proportionality ?
Solution :
The graph represents proportional between number of miles and minutes.
Number of Minutes = x
Number of Miles = y
y = kx
k = y/x
k = 10/2
k = 5
So, the constant of proportionality (k) is 5.
Problem 5 :
Jayden sold mobile phones over four days. Create a graph to determine if there is a proportional relationship between the data. If the quantities are proportional, what is the constant of proportionality ?

Solution :
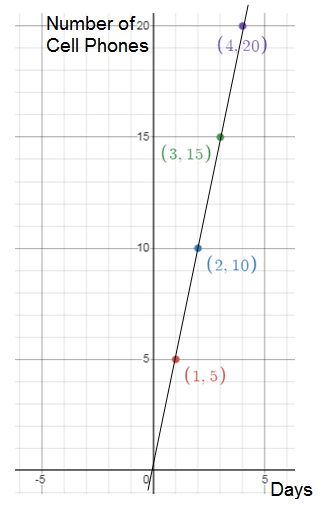
The table represents proportional between quantities of cell phones and number of days.
Number of Days = x
Number of Cell Phones = y
y = kx
k = y/x
k = 5/1
k = 5
So, the constant of proportionality (k) is 5.
Problem 6 :
William made cookies over consecutive hours. Create a graph to determine if a proportional relationship exists between time and the number of cookies made. If the quantities are proportional, what is the constant of proportionality ?

Solution :
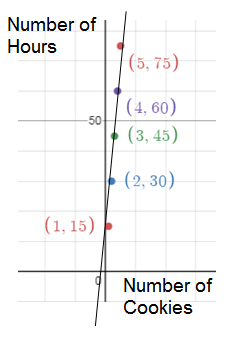
The table represents proportional between time and the number of cookies made.
Number of Cookies = x
Number of Hours = y
y = kx
k = y/x
k = 15/1
k = 15
So, the constant of proportionality (k) is 15.
Problem 7 :
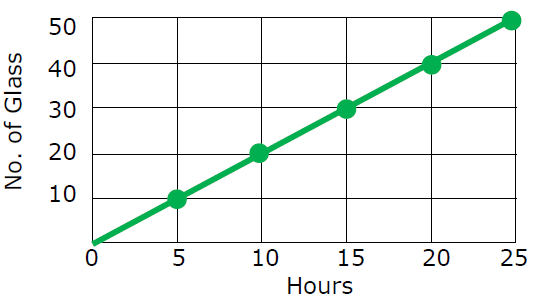
The graph below represents the number of glasses. Torn drank over time. What is the constant of proportionality ?
Solution :
The graph represents proportional between number of glasses and hours.
Number of glasses = x
Number of hours = y
y = kx
k = y/x
k = 10/5
k = 2
So, the constant of proportionality (k) is 2.
Problem 8 :
Mason made omelettes. Create a graph to determine if there is a proportional relationship between the number of eggs used and the number of omelettes made. If the quantities are proportional, what is the constant of proportionality ?

Solution :
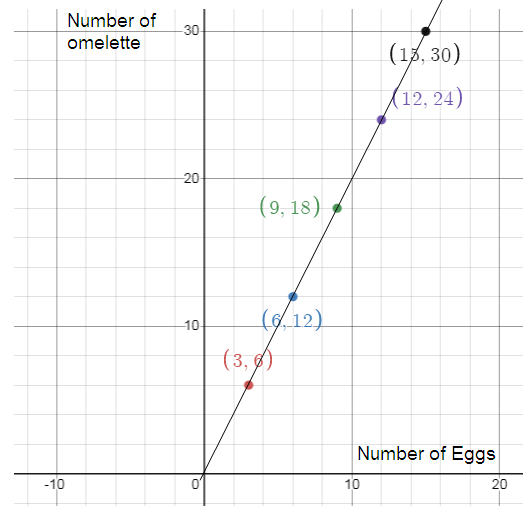
The table represents proportional between number of eggs and the number of omelets made
Number of Eggs = x
Number of omelets = y
y = kx
k = y/x
k = 6/3
k = 2
So, the constant of proportionality (k) is 2.
Problem 9 :
Isabella made necklaces with beads. Create a graph to determine if the quantities of beads and necklace are proportional. If the quantities are proportional, what is the constant of proportionality ?

Solution :
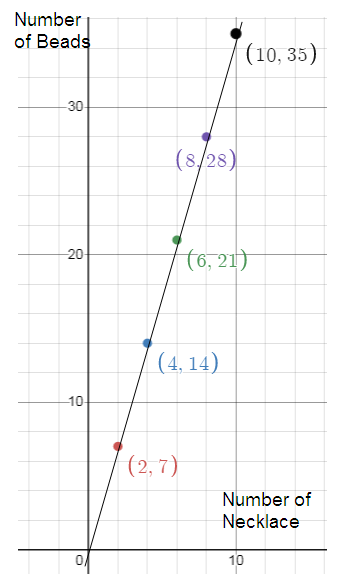
The table represents proportional between quantities of beads and number of necklace.
Number of necklace = x
Number of beads = y
y = kx
k = y/x
k = 7/2
So, the constant of proportionality (k) is 7/2.
Problem 10 :
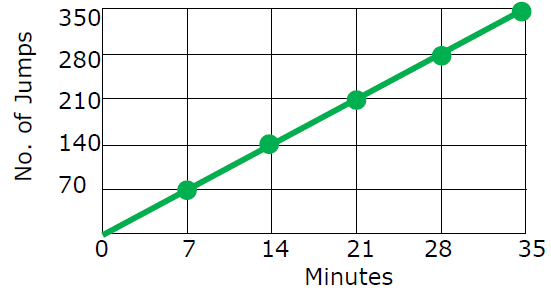
The graph below represents the number of vertical jumps Ava can do over time. What is the constant of proportionality ?
Solution :
The graph represents proportional between number of vertical jumps and minutes.
Number of minutes = x
Number of jumps = y
y = kx
k = y/x
k = 70/7
k = 10
So, the constant of proportionality (k) is 10.
Subscribe to our ▶️ YouTube channel 🔴 for the latest videos, updates, and tips.
Recent Articles
-
Finding Range of Values Inequality Problems
May 21, 24 08:51 PM
Finding Range of Values Inequality Problems -
Solving Two Step Inequality Word Problems
May 21, 24 08:51 AM
Solving Two Step Inequality Word Problems -
Exponential Function Context and Data Modeling
May 20, 24 10:45 PM
Exponential Function Context and Data Modeling