GRAPHING EXPONENTIAL FUNCTIONS WITH ASYMPTOTE
By analyzing the following, we can draw the graph of exponential functions easily.
i) Horizontal asymptote :
Horizontal asymptotes are horizontal lines that the graph of the function approaches as x tends to +∞ or −∞.
ii) y-intercept :
The point where the curve is intersecting y-axis is known as y-intercept.
iii) Finding some points :
By applying some random values of x, we can find out the values of y.
Problem 1 :
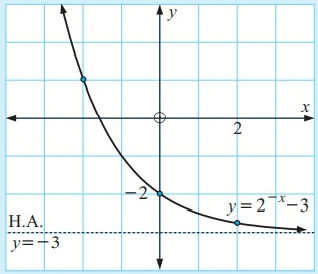
Sketch the graph of y = 2-x – 3.
Solution :
We can graph the given exponential function by analyzing the following
i) Horizontal asymptote
The horizontal asymptote is y = -3.
ii) y – intercept
y – intercept is x = 0
When x = 0, y = 2-0 - 3
= 1 - 3
= -2
∴ The y – intercept is -2
iii) Given any two points 2 and -2.
|
x = 2, y = 2-2 - 3 y = 1/4 - 3 y = (1 – 12)/4 y = -11/4 |
x = -2, y = 22 - 3 y = 4 - 3 y = 1 |
Some the
points on the exponential graph are (0, -4),(-2, 1) and (2, -11/4).

Problem 2 :
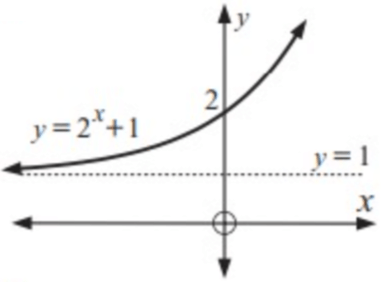
Sketch the graph of y = 2x + 1.
Solution :
We can graph the given exponential function by analyzing the following
i) Horizontal asymptote
The horizontal asymptote is y = 1.
ii) y – intercept
y – intercept is x = 0
When x = 0, y = 20 + 1
= 1 + 1
= 2
∴ The y – intercept is 2
iii) Given any two points say 2 and 3.
|
x = 2 y = 22 + 1 y = 4 + 1 y = 5 |
x = 3 y = 23 + 1 y = 8 + 1 y = 9 |
Some the points on the exponential graph are (0, 2), (2, 5), (3, 9).

Problem 3 :
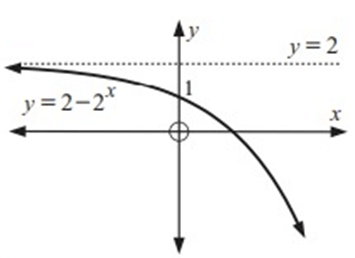
Sketch the graph of y = 2 – 2x.
Solution :
We can graph the given exponential function by analyzing the following
i) Horizontal asymptote
The horizontal asymptote is y = 2.
ii) y – intercept
y – intercept is x = 0
When x = 0, y = 2 – 2x
= 2 - 20
= 2 – 1
= 1
∴ The y – intercept is 1
iii) Given any two points 1 and 2.
|
x = 1, y = 2 - 21 = 2 - 2 = 0 |
x = 2, y = 2 – 22 = 2 - 4 = -2 |
Some the points on the exponential graph are (0, 1), (1, 0) and (2, -2).

Problem 4 :
Sketch the graph of y = 2-x + 3.
Solution :
We can graph the given exponential function by analyzing the following
i) Horizontal asymptote
The horizontal asymptote is y = 3.
ii) y – intercept
y – intercept is x = 0
y = 2-0 + 1
= 1 + 1
= 2
∴ The y – intercept is 2
iii) Given any two points -2 and 2
When x = -2, y = 22 + 1
= 4 + 1
= 5
When x = 2, y = 2-2 + 1
= 1/4 + 1
= (1+4)/4
= 5/4
Some the points on the exponential graph are (0, 2),(-2, 5) and (2, 5/4)

Problem 5 :
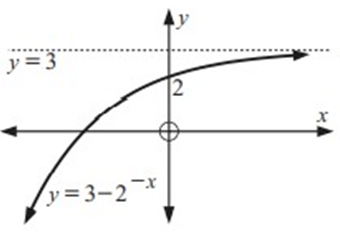
Sketch the graph of y = 3 – 2-x.
Solution :
We can graph the given exponential function by analyzing the following
i) Horizontal asymptote
The horizontal asymptote is y = 3.
ii) y – intercept
y – intercept is x = 0
When x = 0, y = 3 - 2-0
= 3 - 1
= 2
∴ The y – intercept is 2
iii) Given any two points 2 and -2.
When x = 2, y = 3 - 2-2
= 3 - 1/4
= (12 – 1)/4
= 11/4
When x = -2, y = 3 – 22
= 3 – 4
= -1
Some the points on the exponential graph are (0, 2), (2, 11/4), (-2, -1).

Recent Articles
-
Finding Range of Values Inequality Problems
May 21, 24 08:51 PM
Finding Range of Values Inequality Problems -
Solving Two Step Inequality Word Problems
May 21, 24 08:51 AM
Solving Two Step Inequality Word Problems -
Exponential Function Context and Data Modeling
May 20, 24 10:45 PM
Exponential Function Context and Data Modeling