FINDING RATE OF CHANGE FROM A TABLE
To find the rate of change from the table, we have to select two points from the table.
Mark the points as (x1, y1) and (x2, y2), using the formula
slope (m) = (y2 - y1)/(x2 -x1)
Slope (m) = Change in y/Change in x
Problem 1 :
Find the rate of change represented in each table or graph.
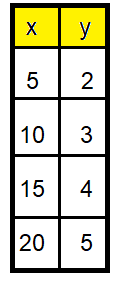
Solution :
Taking two points from the table, we get
(5, 2) and (10, 3).
Slope (m) = (y2 - y1)/(x2 - x1)
= (3 - 2)/(10 - 5)
= 1/5
So, the rate of change is 1/5.
Problem 2 :
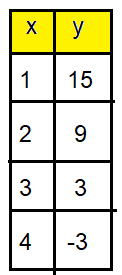
Solution :
Taking two points from the table, we get
(1, 15) and (3, 3).
Slope (m) = (y2 - y1)/(x2 - x1)
= (3 - 15)/(3 - 1)
= -12/2
= -6
So, the rate of change is -6.
Problem 3 :
The table below shows the relationship between
the number of seconds y it takes to hear the thunder after a
lightning strike and the distance x you are from the lightning.
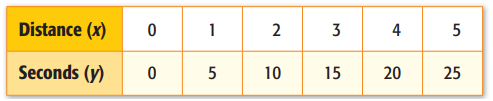
Graph the data. Then find the slope of the line. Explain what the
slope represents.
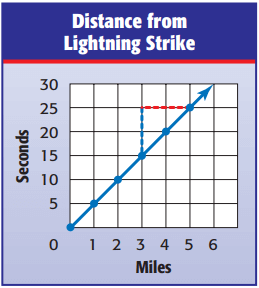
Solution :
Taking two points on the line (3, 15) and (5, 25).
Slope (m) = (25 - 15) / (5 - 3)
= 10/2
= 5
So, for every 5 seconds between a lightning flash and the sound of the thunder, there is 1 mile between you and the lightning strike.
Problem 4 :
Find the slope of the line and explain what the slope represents ?
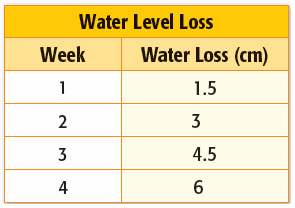
Solution :
Points from the table, (3, 4.5) and (4, 6).
Slope = (6 - 4.5) / (4 - 3)
= 1.5 / 1
= 1.5
So, loss of water level is 1.5 cm.
Problem 5 :
Use the information in the table to find the rate of change in degrees per hour.
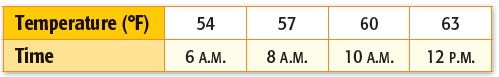
Solution :
Two points from the table (6, 54) and (8, 57).
Slope (m) = (57 - 54) / (8 - 6)
= 3/2
= 1.5 degree per hour.
Problem 6 :
The table below shows the number of small packs of fruit snacks y per box x. Graph the data. Then find the slope of the line. Explain what the slope represents. See
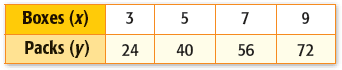
Solution :
(3, 24) and (5, 40)
slope (m) = (40 - 24) / (5 - 3)
= 16/2
= 8 boxes per pack.
Find the rate of change from the table and explain what does the slope represent.
Problem 7 :
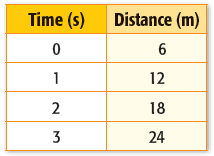
Solution :
Two points from the table are (2, 18) and (3, 24)
Slope (m) = (24 - 18) / (3 - 2)
= 6/1
= 6
Rate of change is 6 m per second.
Problem 8 :

Solution :
Two points from the table are (1, 9) and (2, 18)
Slope (m) = (18 - 9) / (2 - 1)
= 9/1
= 9
Rate of change is $9 m per hour.
Problem 9 :
The number of minutes included in different cell phone plans and the costs are shown in the table. What is the approximate rate of change in cost per minute?
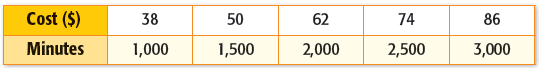
Solution :
Two points from the table (38, 1000) and (50, 1500).
Slope (m) = (1500 - 1000) / (50 - 30)
= 500 / 20
= 25
Rate of change is $25. So, $25 per hour.
Problem 10 :
Dwayne opens a savings account with $75. He makes the same deposit every month and makes no withdrawals. After 3 months, he has $150. After 6 months, he has $300. After 9 months, he has $450 dollars. What is the rate of change?
Solution :
Writing points in the order, (number of months after, balance), we get (3, 150) and (6, 300).
Slope (m) = (300 - 150) / (6 - 3)
= 150/3
= $50 per month
Problem 11 :
The graph shows the cost of traveling by car on a turnpike.

a. Find the slope of the line.
b. Explain the meaning of the slope as a rate of change.
Solution :
a) The points on the lines are (8, 0.6) and (32, 2.40)
Slope = (2.40 - 0.6) / (32 - 8)
= 1.8/24
= 18/240
= 3/40
b) For every 40 miles increase, the amount increases by $3.
Problem 12 :

The above graph displays the total cost C, in dollars of renting a boat for h hours.
What does the C-intercept represent in the graph ?
a) the initial cost of renting the boat
b) The total number of boats rented
c) The total number of hours the boat is rented
d) The increase in cost to rent the boat for each additional hour.
Solution :
- x-axis is number of hours
- y-axis is the total cost in dollars.
The graph shows total cost of renting the boat. So, the C-intercept represents the inital cost of renting the boat.
Recent Articles
-
Finding Range of Values Inequality Problems
May 21, 24 08:51 PM
Finding Range of Values Inequality Problems -
Solving Two Step Inequality Word Problems
May 21, 24 08:51 AM
Solving Two Step Inequality Word Problems -
Exponential Function Context and Data Modeling
May 20, 24 10:45 PM
Exponential Function Context and Data Modeling