FINDING QUARTILES FROM BOX AND WHISKER PLOT WORKSHEET
Problem 1 :
According to the box-and-whisker plot, what was the lower quartile weight of Frank’s classmates?
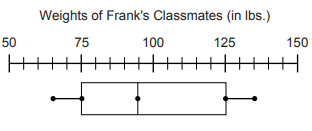
(a) 65 (b) 75 (c) 95 (d) 125
Problem 2 :
According to the box-and-whisker plot, what was the upper quartile of gallons of paint sold at John’s Hardware Store in a month?
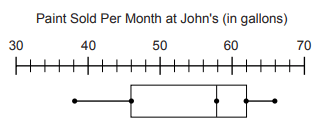
(a) 58 (b) 60 (c) 61 (d) 62
Problem 3 :
According to the box-and-whisker plot, what was the median weight of a pumpkin at the annual pumpkin festival?
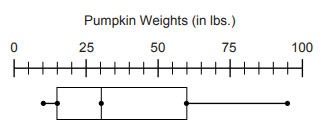
(a) 30 (b) 37.5 (c) 52.5 (d) 60
Problem 4 :
According to the box-and-whisker plot, what was the maximum number of hot dogs eaten in the hot dog eating contest?
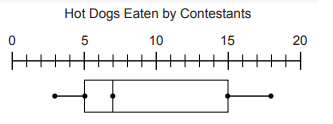
(a) 3 (b) 7 (c) 15 (d) 18
Problem 5 :
What is the median of the data set represented by the box-and-whisker plot?
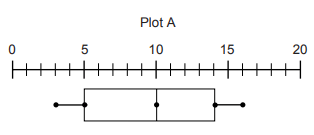
(a) 5 (b) 10 (c) 15 (d) 16
Problem 6 :
According to the box-and-whisker plot, what was the lower quartile of meals served in a day at Susan’s Diner?
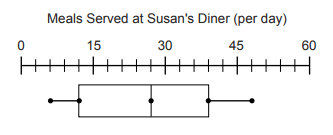
(a) 3 (b) 6 (c) 12 (d) 14
Problem 7 :
For questions 1 – 5, refer to the box & whisker graph below which shows the test results of a math class.

1) What was the high score on the test?
2) What percent of the class scored above a 72?
3) What was the median score on the test?
4) What percent of the class scored between 88 & 96?
5) Do you think that this test was too hard for the students? Explain.
Problem 8 :
Refer to the box & whisker graphs below that compare homework time per night with TV time per night for the same group of sophomores.

1) What percent of the sophomores watch TV for at least 15 minutes per night?
2) What is the 3rd quartile for the TV time data?
Problem 9 :
Refer to the box & whisker graphs below that show the average monthly high temperatures for Milwaukee, Wisconsin & Honolulu, Hawaii.
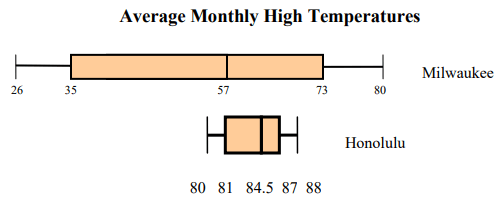
Complete the table using the box and whisker plots for Honolulu and Milwaukee.
|
Median Maximum Minimum Lower quartile Upper quartile Interquartile range |
Milwaukee |
Honolulu |
Answer Key
1) Q1 = 75
2) Q3 = 62 gallons
3) Q2 = 30 lbs
4) Maximum value = 18
5) Median = 10
6) Q1 = 12
7)
|
1) 102 is the highest score 2) 75% 3) Median score = 88 |
4) 25% 5) No |
8) 1) 25% of the sophomores are watching TV for at least 15 minute per night.
2) 3rd quartile (Q3) = 110
9)
|
Median Maximum Minimum Lower quartile Upper quartile Interquartile range |
Milwaukee 57 80 26 35 73 73-35 = 38 |
Honolulu 84.5 88 80 81 87 87-81 = 6 |
Recent Articles
-
Finding Range of Values Inequality Problems
May 21, 24 08:51 PM
Finding Range of Values Inequality Problems -
Solving Two Step Inequality Word Problems
May 21, 24 08:51 AM
Solving Two Step Inequality Word Problems -
Exponential Function Context and Data Modeling
May 20, 24 10:45 PM
Exponential Function Context and Data Modeling