FINDING MEAN MEDIAN MODE FROM DOT PLOT
Subscribe to our ▶️ YouTube channel 🔴 for the latest videos, updates, and tips.
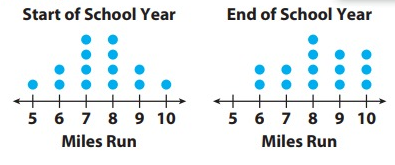
The two dot plots show the number of miles run by 14 students at the start and at the end of the school year. Compare each measure for the two dot plots.

1. means _____
2. medians _____
3. ranges _____
Solution:
Start of the school year:
Range = maximum - minimum
= 10 - 5
= 5
End of the school year:
Median = middle observation
Median = 8
Range = maximum -minimum
= 10 - 6
= 4
Problem 2 :
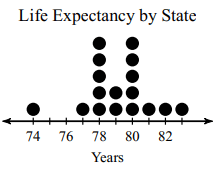
Find mean and median of the data represented in the dot plot.

Solution :
Finding Mean :
Finding Median :
9th element is 79. So, mean = 79 and median = 79
Problem 3 :

Finding Mean :
Finding median :
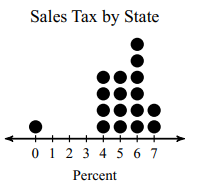
9th element is 5. So, mean is 5.05 and median is 5.
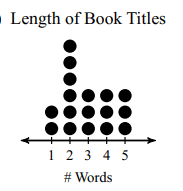
Problem 4 :

Solution :
Finding mean :
Finding median :
Subscribe to our ▶️ YouTube channel 🔴 for the latest videos, updates, and tips.
Recent Articles
-
Finding Range of Values Inequality Problems
May 21, 24 08:51 PM
Finding Range of Values Inequality Problems -
Solving Two Step Inequality Word Problems
May 21, 24 08:51 AM
Solving Two Step Inequality Word Problems -
Exponential Function Context and Data Modeling
May 20, 24 10:45 PM
Exponential Function Context and Data Modeling