FIND STANDARD DEVIATION WITH FREQUENCY IS GIVEN WORKSHEET
Problem 1 :
Find the standard deviation of the distribution :
|
Score 1 2 3 4 5 |
Frequency 1 2 4 2 1 |
Problem 2 :
The weights (in kilograms) of 25 calves were measured and the results placed in a table as shown alongside.
a. Find an estimate of the standard deviation by using interval midpoints.
|
Weight (kg) 50 60 70 80 90 100 |
Frequency 1 3 9 6 4 2 |
Problem 3 :
Find the standard deviation of the following test results.
|
Test score 10 11 12 13 14 15 |
Frequency 4 6 7 2 3 2 |
Problem 4 :
The number of chocolates in 60 boxes was counted and the results tabulated.
|
Number of chocolates 25 26 27 28 29 30 31 32 |
Frequency 1 5 7 13 12 12 8 2 |
Find the mean and standard deviation of the distribution.
Problem 5 :
The lengths of 30 trout were measured to the nearest cm and the following data obtained :
Find estimates of the mean length and the standard deviation of the lengths.
|
Length (cm) 30 32 34 36 38 40 42 |
Frequency 1 1 3 7 11 5 2 |
Answer Key
1) Mean = 3 and standard deviation = 1.10
2) Mean = 76 and standard deviation = 16.95
3) Mean = 12 and standard deviation = 1.5
4) Mean = 28.8 and standard deviation = 1.67
5) Mean = 37.26 and standard deviation = 2.65
Problem 1 :
The weekly wages (in dollars) of 90 workers in a steel yard are given alongside :
Find estimates of the mean wage and the standard deviation of the wages.
|
Wage ($) 360 - 369.99 370 - 379.99 380 - 389.99 390 - 399.99 400 - 409.99 410 - 419.99 420 - 429.99 430 - 439.99 |
Number of Workers 5 16 27 16 12 8 4 2 |
Problem 2 :
A random sample of the weekly supermarket bills for a number of families was observed and recorded in the table given.
a. Find the mean bill and the standard deviation of the bills.
b. variance of the population
|
Bill ($) 70 - 79.99 80 - 89.99 90 - 99.99 100 - 109.99 110 - 119.99 120 - 129.99 130 - 139.99 140 - 149.99 |
No. of families 27 32 48 25 37 21 18 7 |
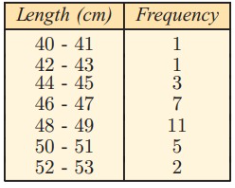
Problem 3 :
The length of 30 randomly selected 12 day old babies were measured to the nearest cm and the following data obtained.
i) Find the mean length and standard deviation of the lengths.
ii) Find the variance.

Answer Key
1) Mean wages = 392.10, Standard deviation = 16.34
2) Mean = 103.50, Standard deviation = 19.14
b) Variance = 366.33
3) i) Mean = 47.76, standard deviation = 2.65
ii) Variance = 7.05
Recent Articles
-
Finding Range of Values Inequality Problems
May 21, 24 08:51 PM
Finding Range of Values Inequality Problems -
Solving Two Step Inequality Word Problems
May 21, 24 08:51 AM
Solving Two Step Inequality Word Problems -
Exponential Function Context and Data Modeling
May 20, 24 10:45 PM
Exponential Function Context and Data Modeling