FIND MEAN MEDIAN MODE FROM DOT PLOT WORKSHEET
Subscribe to our ▶️ YouTube channel 🔴 for the latest videos, updates, and tips.
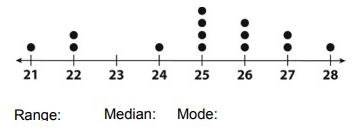
Find the range, median and mode values for each dot plot.
Problem 1 :

Problem 2 :

Problem 3 :

1. How do the ranges compare?
2. Compare the number of elements.
3. How do the modes compare?
4. How do the medians compare?
5. Describe the distribution of the dots in each plot.
Answer Key
1) Range = 7, median = 25 and mode = 25
2) Range = 0.7, median = 0.15, mode = 0.16
3) Range = 3,
Number of dots in plot A = 7, number of dots in plot B = 9
Median :
Plot A = 21, Plot B = 23
Mode :
Plot A = 21, Plot B = 23 and 24.
Problem 1 :
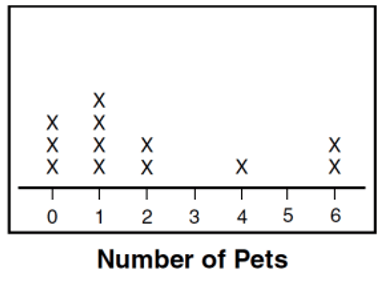
Use the line plot. Find the
(i) Mean (ii) Median (iii) Mode and (iv) Range
of the data.

Problem 2 :
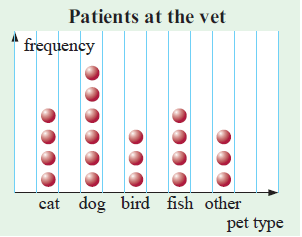
The dot plot shows the types of pets treated at a vet on one day.
a) How many pets were treated on this day?
b) Find the mode of the data.
c) What percentage of the pets treated were fish?

Problem 3 :
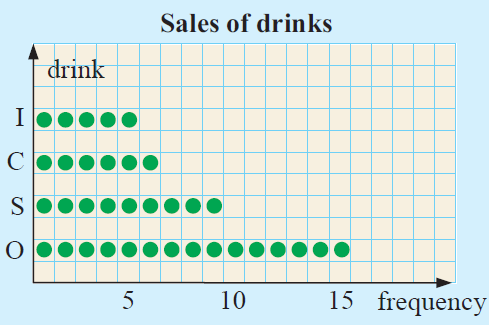
At recess time the sales of drinks were recorded over a three minute period.
O = 100 plus, S = soy milk, C = cola, I = iced tea.
The data was: OSSCI OCISO IOCSO OOOSC SOCOS SOOCO OIOIS
a) Draw a dot plot of the data. b What is the mode?
Problem 3 :
Four girls on a high school track and field team practice the shot put. Each girl made 10 attempts, and the distances measure after each attempt are shown on the plots below.
a) Which girl’s range of distance was the greatest?
Problem 4 :
Find the mean, median, and mode of each dot plot.

Answer Key
1) mean = 2, median = 1, mode = 1, range = 6
2) a) Total number of pets treated on that day = 20
b) Mode :
Mode of the data is dog.
c) Percentage of fishes treated = 20%
3) a)

b) 100 plus is the mode.
Range of distance of Candance's attempts = 41 - 33
= 8
Range of distance of Sara's attempts = 42 - 35
= 7
4) a) Mean = 8, Median = 8, mode is 3.
b) Mean = 22.95, Median = 25, mode = 20 and 25
Subscribe to our ▶️ YouTube channel 🔴 for the latest videos, updates, and tips.
Recent Articles
-
Finding Range of Values Inequality Problems
May 21, 24 08:51 PM
Finding Range of Values Inequality Problems -
Solving Two Step Inequality Word Problems
May 21, 24 08:51 AM
Solving Two Step Inequality Word Problems -
Exponential Function Context and Data Modeling
May 20, 24 10:45 PM
Exponential Function Context and Data Modeling