DRAWING BOX AND WHISKER PLOTS FROM THE GIVEN DATA WORKSHEET
Draw a box plot for each of the following.
Problem 1:
Problem 2 :
Problem 3 :
Draw a box plot for each of the following.
Problem 4 :
Problem 5 :
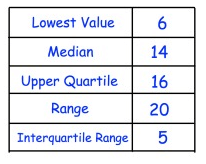
Problem 6 :
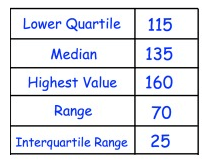
Answer Key
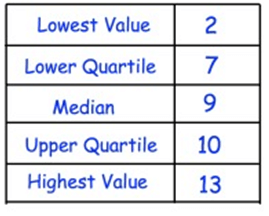
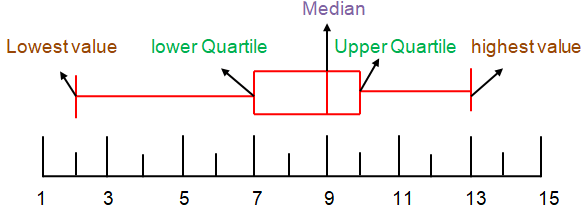
1)
Least value = 2
Lower Quartile (Q1) = 7
Median (Q2) = 9
Upper Quartile (Q3) = 10
Highest value = 13
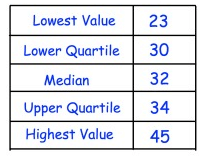
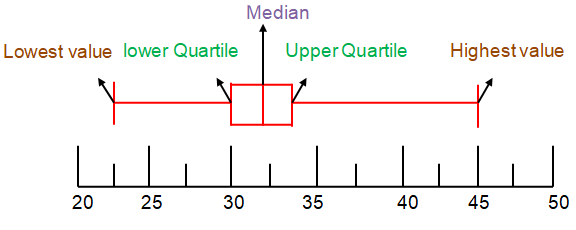
2)
Least value = 23
Lower Quartile (Q1) = 30
Median (Q2) = 32
Upper Quartile (Q3) = 34
Highest value = 45
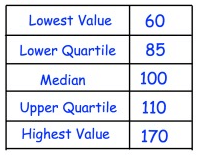
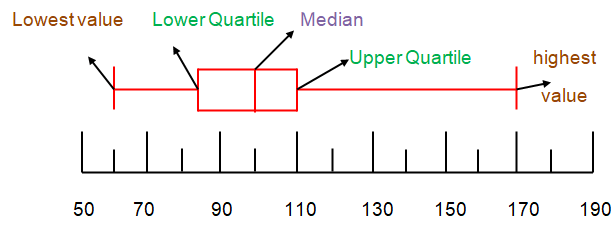
3)
Least value = 60
Lower Quartile (Q1) = 81
Median (Q2) = 100
Upper Quartile (Q3) = 110
Highest value = 170
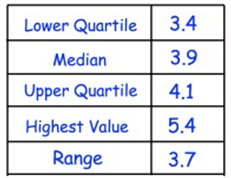
4)
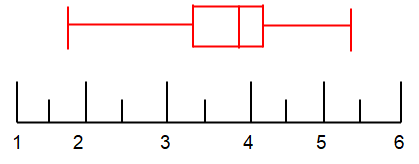
Range = largest value - smallest value
3.7 = 5.4 - x
x = 1.7
Smallest value = 1.7
5)
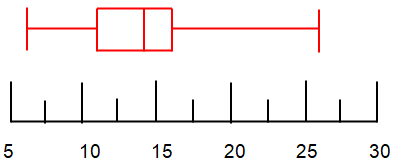
Range = largest value - smallest value
20 = x - 6
x = 26
Largest value = 26
Interquartile Range = Upper Quartile - Lower Quartile
5 = 16 - x
x = 11
Lower Quartile = 11
6)
Range = largest value - smallest value
70 = 160 - x
x = 90
Smallest value = 90
Interquartile Range = Upper Quartile - Lower Quartile
25 = x - 115
x = 140
Upper Quartile = 140

Recent Articles
-
Finding Range of Values Inequality Problems
May 21, 24 08:51 PM
Finding Range of Values Inequality Problems -
Solving Two Step Inequality Word Problems
May 21, 24 08:51 AM
Solving Two Step Inequality Word Problems -
Exponential Function Context and Data Modeling
May 20, 24 10:45 PM
Exponential Function Context and Data Modeling