DRAW THE STEM AND LEAF PLOT FOR THE DATA SET
Subscribe to our ▶️ YouTube channel 🔴 for the latest videos, updates, and tips.
Subscribe to our ▶️ YouTube channel 🔴 for the latest videos, updates, and tips.
A Stem and Leaf Plot is a special table where each data value is split into a "stem" (the first digit or digits) and a "leaf" (usually the last digit).
How to draw stem and leaf plot ?
Step 1 :
Determine the smallest and largest number in the data.
Step 2 :
Identify the stems
Step 3 :
Draw a vertical line and list the stem numbers to the left of the line
Step 4 :
Fill in the leaves.
Step 5 :
Sort the leaf data.
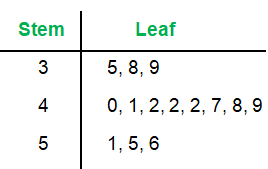
Problem 1 :
Here are the ages of 14 adults.
42 35 56 39 40 51 47
38 42 55 42 48 49 41
Draw an ordered stem and leaf diagram for these ages.
Solution :
Let us write the ages in the data in ascending order.
35, 38, 39, 40, 41, 42, 42, 42, 47, 48, 49, 51, 55, 56
Problem 2 :
Helen plays darts.
Here are her scores.
55 23 48 29 41 47 36
35 40 35 44 34 35
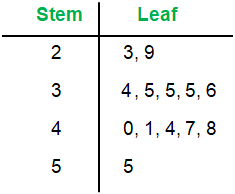
a) Draw an ordered stem and leaf diagram to show her scores.
b) Write down the mode.
c) Work out the range.
Solution :
a)
Let us write the scores in the data in ascending order.
23, 29, 34, 35, 35, 35, 36, 40, 41, 44, 47, 48, 55
b) Mode:
Mode = 35 score
c) Range:
Range = Large value - Small value
= 55 - 23
Range = 32 score
Problem 3 :
Here are the lengths in millimeters of 15 earthworms.
43 19 35 28 21
28 28 18 24 33
31 36 12 41 28
a) Complete an ordered stem and leaf diagram to show this information.
b) How many earthworms are over 40 millimeters?
c) Write down the mode.
d) What fraction of the earthworms are under 20 millimeters?
Solution :
a)
Let us write the observations in the data in ascending order.
12, 18, 19, 21, 24, 28, 28, 28, 28, 31, 33, 35, 36, 41, 43
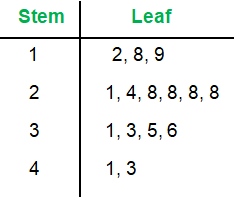
b) 2 earthworms are over 40 millimeters.
c) Mode:
Mode = 28
d)
3 earthworms are under 20 millimetres.
Fraction = 3/15
= 1/5
Problem 4:
The number of people visiting a café each day, for 11 days, is listed below.
104 131 120 115 109 124
128 118 116 120 125
a) Complete an ordered stem and leaf diagram for this information. A key has been included.
b) Write down the mode.
c) Write down the median.
d) Write down the range.
Solution :
a)
Let us write the observations in the data in ascending order.
104, 109, 115, 116, 118, 120, 120, 124, 125, 128, 131
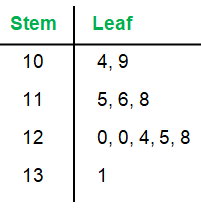
Key: 10|4 means 104
b) Mode :
Mode = 120
c) Median :
Median = 120
d) Range :
Range = Large value - Small value
= 131 - 104
Range = 27
Problem 5 :
The number of passengers on 10 buses was recorded. The stem and leaf diagram shows this information.
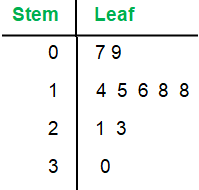
a) Work out the median.
A bus is selected at random.
b) What is the probability the bus has more than 20 passengers?
The next bus has 32 passengers.
c) Find the range.
Solution :
7, 9, 14, 15, 16, 18, 18, 21, 23, 30
a) Median:
Median = (16 + 18) / 2
= 34/2
Median = 17
b) P (more than 20 passengers) = 3/10
c) Tick the box to show how this will effect the range.
Range = large value - small value
30 - 7 = 23
So, the range is 23.
Problem 6 :
The weights of books on a shelf are recorded in a stem and leaf diagram.
Key: 0|1 means 0.1 kg
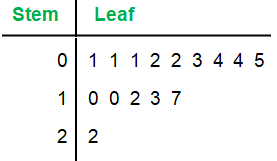
(a) Write down the median.
(b) Work out the total weight of books on the shelf.
A book weighting 1.8 kg is added to the shelf.
Peter says the median will remain the same.
(c) Is peter correct? Explain your answer.
Solution :
0.1, 0.1, 0.1, 0.2, 0.2, 0.3, 0.4, 0.4, 0.5, 1.0, 1.0, 1.2, 1.3, 1.7, 2.2
a) Median
Median = 0.4 kg
b)
Total weight = 0.1+ 0.1+ 0.1+ 0.2 + 0.2 + 0.3 + 0.4 + 0.4 + 0.5 + 1.0 + 1.0 + 1.2 + 1.3 + 1.7 + 2.2
= 10.7 kg
c) No, it would increase to 0.45 kg.
Recent Articles
-
Finding Range of Values Inequality Problems
May 21, 24 08:51 PM
Finding Range of Values Inequality Problems -
Solving Two Step Inequality Word Problems
May 21, 24 08:51 AM
Solving Two Step Inequality Word Problems -
Exponential Function Context and Data Modeling
May 20, 24 10:45 PM
Exponential Function Context and Data Modeling