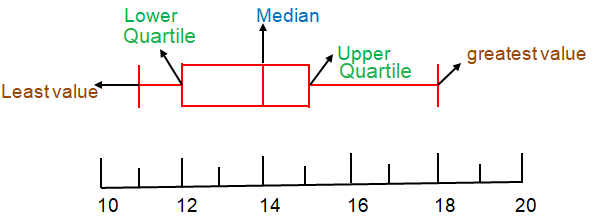
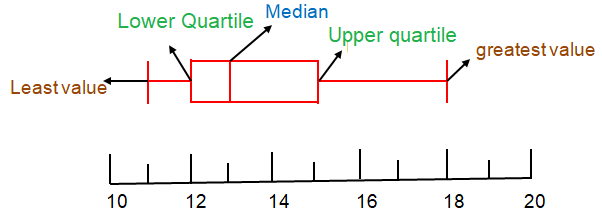
DRAW BOX AND WISHKER PLOT FOR THE GIVEN DATA
Subscribe to our ▶️ YouTube channel 🔴 for the latest videos, updates, and tips.
To draw the box and whisker plot, we have to follow the instruction given below.
Step 1 :
Arrange the data from least to greatest
Step 2 :
Calculate the median(Q2) which divides the data into two equal parts.
Step 3 :
- Calculate the lower quartile (Q1) by finding the median of lower half.
- Calculate the upper quartile (Q3) by finding the median of upper half.
Step 4 :
- Starting from the least value draw the tail and at least value start drawing box.
Problem 1 :
Draw a box and whisker plot for the data set:
12, 14, 14, 12, 16, 13, 11, 14, 18
Solution:
Let us write the observations in the data in ascending order.
11, 12, 12, 13, 14, 14, 14, 16, 18
Median is dividing the data set into two parts.
Lower quartile Q1:
The data set is having four values. So,
Q1 = (12 + 12) / 2
= 24/2
Q1 = 12
Upper quartile Q3:
The data set is having four values. So,
Q3 = (14 + 16) / 2
= 30/2
Q3 = 15
Median Q2:
The median is the middle value in a set of data.
So, median Q2 = 14

Problem 2 :
Draw a box and whisker plot for the data set:
16, 14, 13, 13, 18, 12, 11, 12, 12
Solution :
Let us write the observations in the data in ascending order.
11, 12, 12, 12, 13, 13, 14, 16, 18
Median is dividing the data set into two parts.
Median of lower half Q1:
The data set is having four values. So,
Q1 = (12 + 12) / 2
= 24/2
Q1 = 12
Median of upper half Q3:
The data set is having four values. So,
Q3 = (14 + 16) / 2
= 30/2
Q3 = 15
Median Q2:
The median is the middle value in a set of data.
So, median Q2 = 13

Problem 3:
Draw a box and whisker plot for the data set:
32, 34, 36, 37, 36, 37, 38, 37, 38
Solution :
Let us write the observations in the data in ascending order.
32, 34, 36, 36, 37, 37, 37, 38, 38
Median is dividing the data set into two parts.
Median of lower half Q1:
The data set is having four values. So,
Q1 = (34 + 36) / 2
= 70/2
Q1 = 35
Median of upper half Q3:
The data set is having four values. So,
Q3 = (37 + 38) / 2
= 75/2
Q3 = 37.5
Median Q2:
The median is the middle value in a set of data.
So, median Q2 = 37

Problem 4 :
Draw a box and whisker plot for the data set:
22, 24, 25, 26, 21, 22, 28, 29, 23
Solution :
Let us write the observations in the data in ascending order.
21, 22, 22, 23, 24, 25, 26, 28, 29
Median is dividing the data set into two parts.
Median of lower half Q1:
The data set is having four values. So,
Q1 = (22 + 22) / 2
= 44/2
Q1 = 22
Median of upper half Q3:
The data set is having four values. So,
Q3 = (26 + 28) / 2
= 54/2
Q3 = 27
Median Q2:
The median is the middle value in a set of data.
So, median Q2 = 24

Problem 5 :
Draw a box and whisker plot for the data set:
52, 52, 55, 55, 53, 56, 57, 57, 58
Solution :
Let us write the observations in the data in ascending order.
52, 52, 53, 55, 55, 56, 57, 57, 58
Median is dividing the data set into two parts.
Median of lower half Q1:
The data set is having four values. So,
Q1 = (52 + 53) / 2
= 105/2
Q1 = 52.5
Median of upper half Q3:
The data set is having four values. So,
Q3 = (57 + 57) / 2
= 114/2
Q3 = 57
Median Q2:
The median is the middle value in a set of data.
So, median Q2 = 55

Problem 6 :
Draw a box and whisker plot for the data set:
34, 38, 34, 37, 32, 32, 39, 34, 39
Solution :
Let us write the observations in the data in ascending order.
32, 32, 34, 34, 34, 37, 38, 39, 39
Median is dividing the data set into two parts.
Median of lower half Q1:
The data set is having four values. So,
Q1 = (32 + 34) / 2
= 66/2
Q1 = 33
Median of upper half Q3:
The data set is having four values. So,
Q3 = (38 + 39) / 2
= 77/2
Q3 = 38.5
Median Q2:
The median is the middle value in a set of data.
So, median Q2 = 34

Problem 7 :
Draw a box and whisker plot for the data set:
50, 51, 52, 58, 58, 59, 49, 50, 49
Solution :
Let us write the observations in the data in ascending order.
49, 49, 50, 50, 51, 52, 58, 58, 59
Median is dividing the data set into two parts.
Median of lower half Q1:
The data set is having four values. So,
Q1 = (49 + 50) / 2
= 99/2
Q1 = 49.5
Median of upper half Q3:
The data set is having four values. So,
Q3 = (58 + 58) / 2
= 116/2
Q3 = 58
Median Q2:
The median is the middle value in a set of data.
So, median Q2 = 51

Problem 8 :
Draw a box and whisker plot for the data set:
37, 38, 36, 33, 34, 32, 34, 37, 32
Solution :
Let us write the observations in the data in ascending order.
32, 32, 33, 34, 34, 36, 37, 37, 38
Median is dividing the data set into two parts.
Median of lower half Q1:
The data set is having four values. So,
Q1 = (32 + 33) / 2
= 65/2
Q1 = 32.5
Median of upper half Q3:
The data set is having four values. So,
Q3 = (37 + 37) / 2
= 74/2
Q3 = 37
Median Q2:
The median is the middle value in a set of data.
So, median Q2 = 34

Problem 9 :
Draw a box and whisker plot for the data set:
18, 16, 15, 19, 11, 14, 12, 14, 16
Solution :
Let us write the observations in the data in ascending order.
11, 12, 14, 14, 15, 16, 16, 18, 19
Median is dividing the data set into two parts.
Median of lower half Q1:
The data set is having four values. So,
Q1 = (12 + 14) / 2
= 26/2
Q1 = 13
Median of upper half Q3:
The data set is having four values. So,
Q3 = (16 + 18) / 2
= 34/2
Q3 = 17
Median Q2:
The median is the middle value in a set of data.
So, median Q2 = 15

Problem 10 :
Draw a box and whisker plot for the data set:
55, 56, 58, 59, 54, 54, 51, 53, 52
Solution :
Let us write the observations in the data in ascending order.
51, 52, 53, 54, 54, 55, 56, 58, 59
Median is dividing the data set into two parts.
Median of lower half Q1:
The data set is having four values. So,
Q1 = (52 + 53) / 2
= 105/2
Q1 = 52.5
Median of upper half Q3:
The data set is having four values. So,
Q3 = (56 + 58) / 2
= 114/2
Q3 = 57
Median Q2:
The median is the middle value in a set of data.
So, median Q2 = 54

Subscribe to our ▶️ YouTube channel 🔴 for the latest videos, updates, and tips.
Recent Articles
-
Finding Range of Values Inequality Problems
May 21, 24 08:51 PM
Finding Range of Values Inequality Problems -
Solving Two Step Inequality Word Problems
May 21, 24 08:51 AM
Solving Two Step Inequality Word Problems -
Exponential Function Context and Data Modeling
May 20, 24 10:45 PM
Exponential Function Context and Data Modeling