DESCRIBING THE CORRELATION OF A SCATTER PLOT WORKSHEET
Problem 1 :
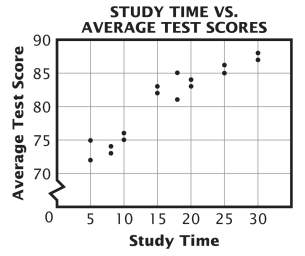
Ms. Thomas wanted to know if the amount of class time that he gave students to study affected their test scores. The scatter plot below shows the result.

What kind of relationship between class study time and test scores is shown in the scatterplot?
a) no correlation b) Positive correlation
c) negative correlation
d) positive than negative correlation
Problem 2 :
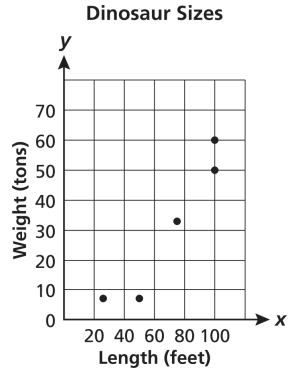
The following scatterplot shows the weight and lengths of some dinosaurs.

Which statement accurately describes the information in the scatter plot ?
a) The information shows a positive correlation. The weight f a dinosaur tends to increase according to its length.
b) The information shows a negative correlation. The weight of a dinosaur tends to decrease according to its length.
c) The information shows no correlation. The weight and length vary according to the type of dinosaur.
d) The information shows no correlation. The relationship between the weight and length of a dinosaur is uncertain.
Problem 3 :
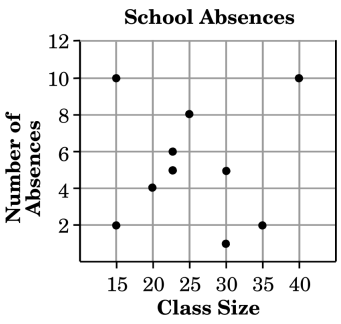
The scatterplot shows the number of absences in a week for classes of different sizes. Trevor concluded that there is a positive correlation between class size and the number of absences.

Which statement best describes why Trevor's conclusion was incorrect ?
a) The largest class does not have the most absences.
b) The smallest class does not have the least number of absences.
c) The data show no relationship between class size and the number of absences.
d) The data show a negative relationship between class size and number of absences.
Problem 4 :
Which data will most likely to show a negative correlation when graphed on a scatterplot
a) the outside temperature and the number of people wearing gloves.
b) the distance a student lives from school and the amount of time it takes to get to school.
c) the number of visitors at an amusement park and the length of the lines for the rides.
d) a student's height and grade point average.
Problem 5 :
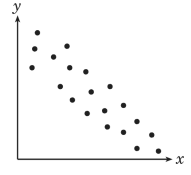
This scatterplot could show the relationship between which two variables ?

a) speed of an airplane (x) vs distance traveled in one hour (y)
b) outside air temperature (x) vs air conditioning cost (y)
c) age of an adult (x) vs height of an adult (y)
d) distance traveled (x) vs gas remaining in the tank (y)
Answer Key
1) So it is positive correlation.
2) As length of dinosaur is increasing weight is also increasing, option a.
3) The largest class (40) has 10 absences. So, option a is correct.
4) If temperature decrease outside, then number of people wearing gloves will increase, because of cold, option a.
5) option d.
Recent Articles
-
Finding Range of Values Inequality Problems
May 21, 24 08:51 PM
Finding Range of Values Inequality Problems -
Solving Two Step Inequality Word Problems
May 21, 24 08:51 AM
Solving Two Step Inequality Word Problems -
Exponential Function Context and Data Modeling
May 20, 24 10:45 PM
Exponential Function Context and Data Modeling