Learn Math step-by-step
CONSTRUCTING BAR GRAPHS WITH UNGROUPED DATA
Complete the following bar charts :
Problem 1 :

Complete the bar chart below :
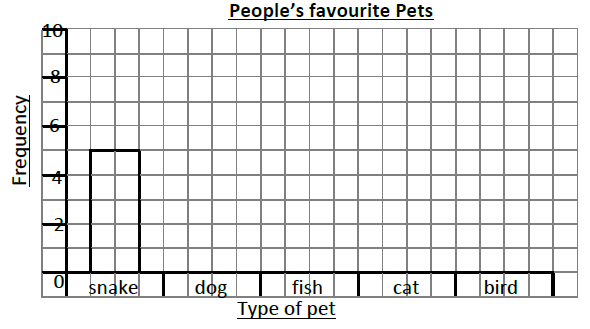
Solution :
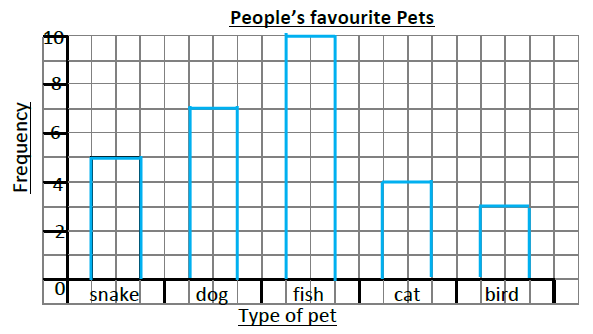
Problem 2 :
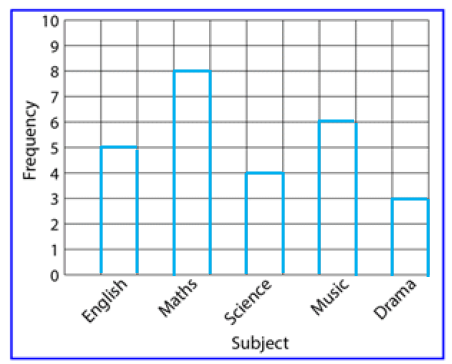
Here are the results of the favourite subjects for 26 students in year 9. Represent this data in a Bar Chart.
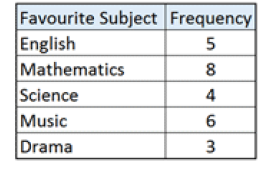
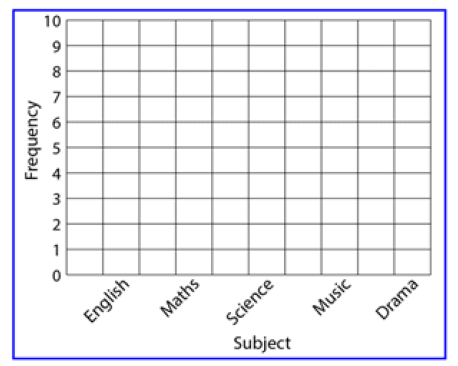
Solution :
Problem 3 :

Draw the bar chart on the grid below.
Solution :
Problem 4 :

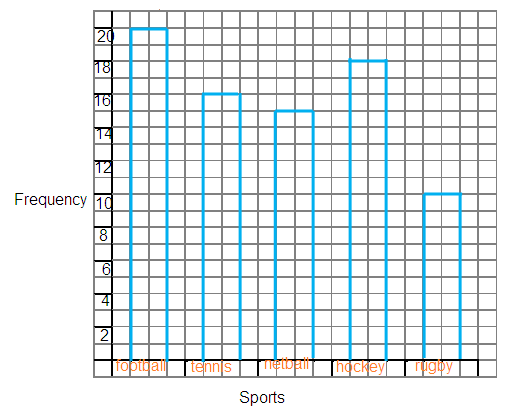
Draw the bar chart on the grid below.
Solution :
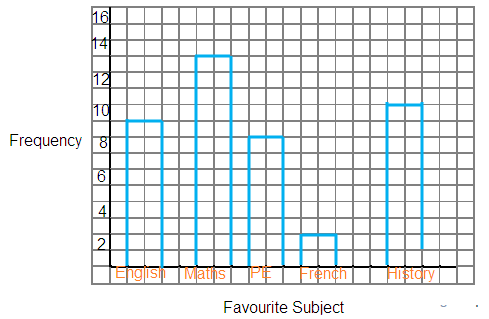
Problem 5 :

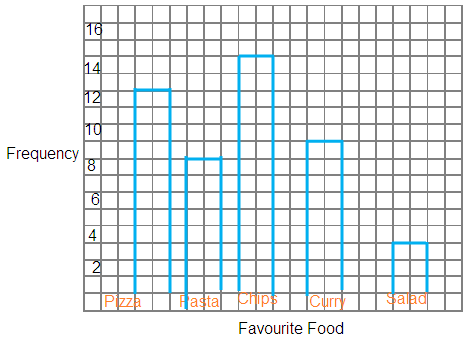
Draw the bar chart on the grid below.
Solution :
Recent Articles
-
Finding Range of Values Inequality Problems
May 21, 24 08:51 PM
Finding Range of Values Inequality Problems -
Solving Two Step Inequality Word Problems
May 21, 24 08:51 AM
Solving Two Step Inequality Word Problems -
Exponential Function Context and Data Modeling
May 20, 24 10:45 PM
Exponential Function Context and Data Modeling