CONSTRUCT A FREQUENCY TABLE FOR UNGROUPED DATA
Definition of frequency distribution table :
A frequency distribution table is a chart that summarizes all the data under two columns - variables/categories, and their frequency.
What is frequency ?
Number of times repeating is known as frequency.
How it is helpful ?
A frequency distribution table is a way to organize data so that it makes the data more meaningful.
What is tally marks ?
Tally marks are defined in the unary numeral system. It is a form of numeral used for counting. The general way of writing tally marks is as a group or set of five lines.
|
Numerals 1 2 3 4 |
Tally marks | || ||| |||| |
|
|
To write 5, we use this |
Problem 1 :
A class of twenty pupils made a list of their pets.

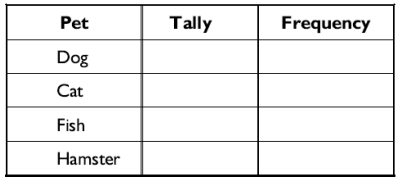
a) Complete the frequency table given above.
b) How many pets are there ?
Solution :
a)
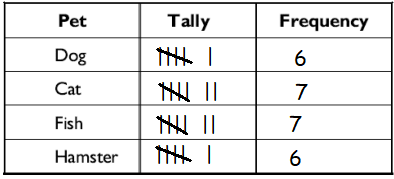
b) Total number of pets = 6 + 7 + 7 + 6
= 26
So, there are 26 pets in total.
Problem 2 :
Here are the colors of 40 cars in the school car park:
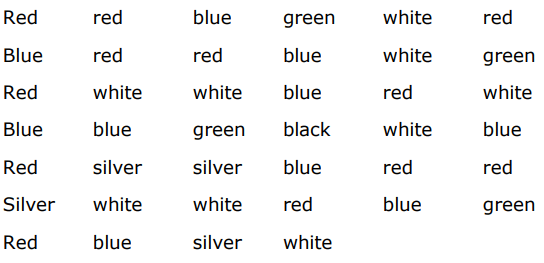
i) Complete the table
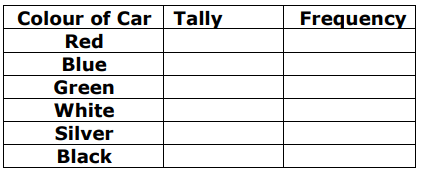
(ii) What is the most popular color?
(iii) Which color represents 25% of the total cars?
Solution :
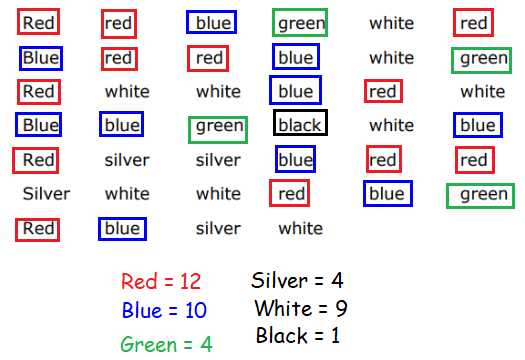
i)
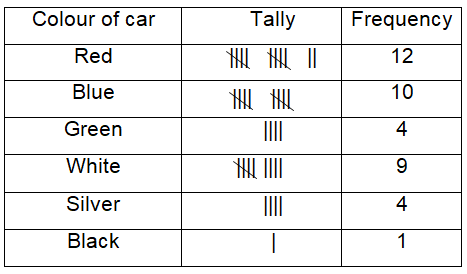
(ii) The most popular color is red.
(iii) Total number of cars = 40
25% of total cars = 0.25(40)
= 10
So, 25% of cars is blue.
Problem 3 :
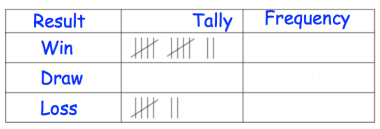
Cardiff Rovers Football Club played 30 games in a season.
(a) Complete the tally and frequency columns.
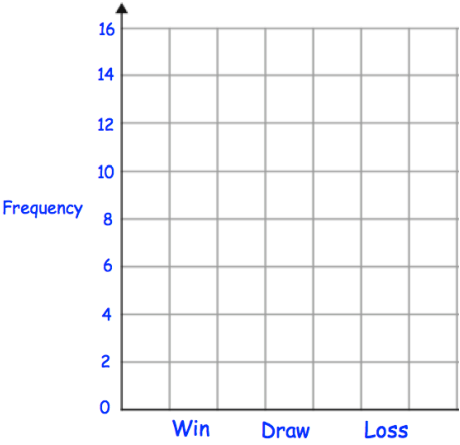
(b) Draw a bar chart to show this information.
(c) What was the most common type of result for Cardiff Rovers? .............................
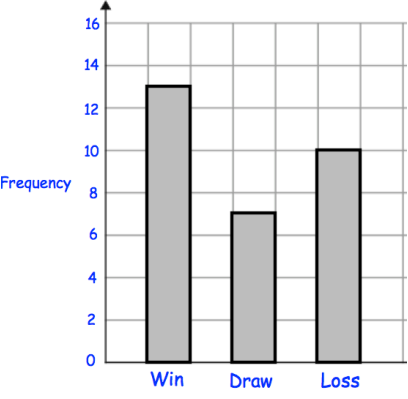
(d) Newport United Football Club play in the same league. Their results in the same season are shown below.
- A win is worth 3 points.
- A draw is worth 1 point.
- A loss is worth 0 points.
Which club finished the season with more points and by how many?
Solution :
a)

(b)
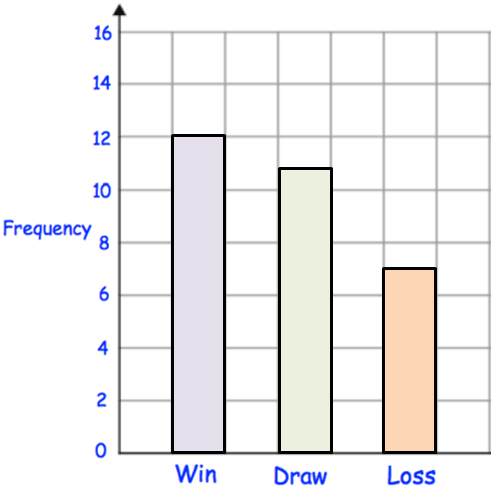
(c) Win is the most common type.
(d)
 |
 |
|
= 12(3) + 11(1) + 7(0) = 36 + 11 + 0 = 47 |
= 13(3) + 7(1) + 10(0) = 39 + 7 + 0 = 46 |
Cardiff Rovers Football Club has finished more points.
Problem 4 :
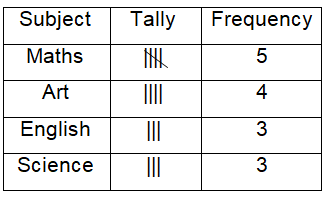
A group of students were asked their favourite subject. Here are their replies.

(a) Show this information in a tally chart.
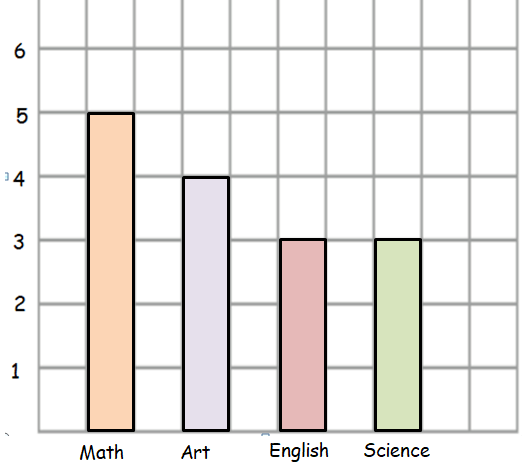
(b) Draw a bar chart to show this information.
Solution :
a)
b)
Problem 5 :
A class of 20 students complete a test. The test is marked out of 50. The scores are recorded below.

(a) Complete the tally and frequency columns in the chart below.
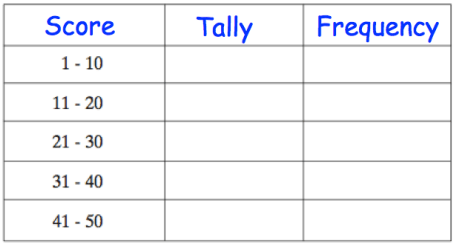
(b) How many students scored between 21 - 30 marks?
(c) What fraction of the students scored 41 - 50 marks?
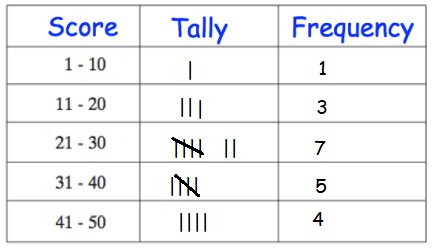
(b) There are 7 students in between 21 - 30 marks.
(c) (4/20) x 100%
= 20%
Recent Articles
-
Finding Range of Values Inequality Problems
May 21, 24 08:51 PM
Finding Range of Values Inequality Problems -
Solving Two Step Inequality Word Problems
May 21, 24 08:51 AM
Solving Two Step Inequality Word Problems -
Exponential Function Context and Data Modeling
May 20, 24 10:45 PM
Exponential Function Context and Data Modeling