COMPARING THE DISTRIBUTION OF BOX PLOTS
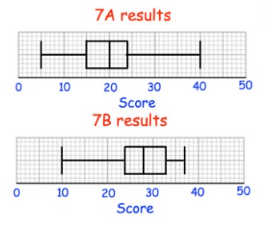
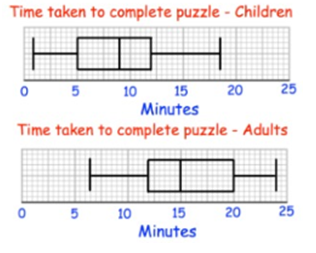
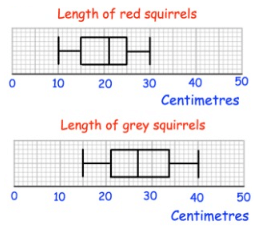
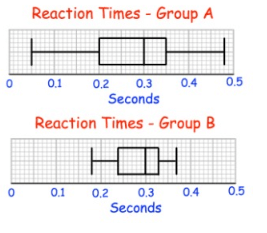
Compare the distributions of each pair of box plots below.
Problem 1 :

Solution :
Comparing median will give the best result.
Median of 7A = 20
Median of 7B = 28 (approximately)
By comparing the median, it is clear, performance of 7B is good.
Problem 2 :

Solution :
Median time taken to complete the puzzle for children = 8
Median time taken to complete the puzzle for adults = 15
So, adults are taking much time to complete the puzzle.
Problem 3 :

Solution :
Median length of red squirrels = 21
Median length of grey squirrels = 26
So, average length of grey squirrels are greater.
Problem 4 :

Solution :
Median reaction time of group A = 0.3
Median reaction time of group B = 0.3
So, reaction time of both groups are same.
Recent Articles
-
Finding Range of Values Inequality Problems
May 21, 24 08:51 PM
Finding Range of Values Inequality Problems -
Solving Two Step Inequality Word Problems
May 21, 24 08:51 AM
Solving Two Step Inequality Word Problems -
Exponential Function Context and Data Modeling
May 20, 24 10:45 PM
Exponential Function Context and Data Modeling