COMPARING LINEAR FUNCTIONS
Subscribe to our ▶️ YouTube channel 🔴 for the latest videos, updates, and tips.
A rate of change is a rate that describes how one quantity changes in relation to another quantity. If x is the independent variable and y is the dependent variable, then
Rate of change = Change in y/ Change in x
Examine each set of functions and determine which has the greater rate of change, if either. Explain your reasoning.
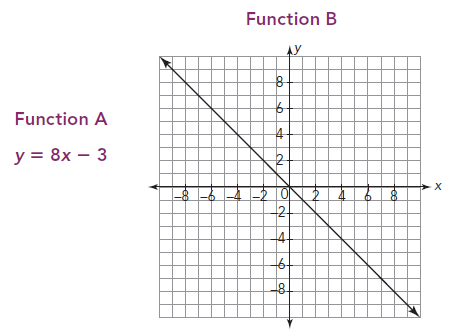
Problem 1 :
Solution :
From function A :
y = 8x - 3
Comparing the given equation with slope intercept form
y = mx + b
m = 8
From function B :
Taking two points on the graph, (0, 0) and (2, 2)
(x1, y1) ==> (0, 0) and (x2, y2) ==> (2, 2)
Change in y = (2 - 0) ==> 2
Change in x = (2 - 0) ==> 2
Slope = Change in y / change in x ==> 2/2 ==> 1
Function A is having greater rate of change.
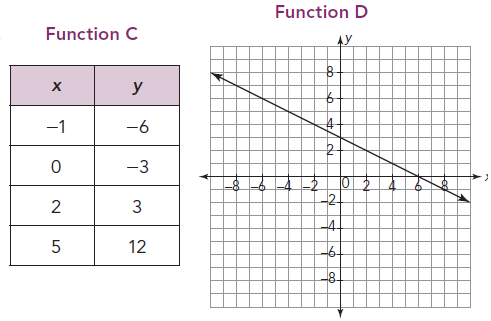
Problem 2 :
Solution :
Rate of change from function C :
Taking two points from the table, (-1, -6) and (0, -3).
Slope (m) = (y2 - y1) / (x2 - x1)
m = (3 + 6) / (0 + 1)
m = 9/1
m = 9
Rate of change from function D :
Taking two points from the table, (0, 3) and (6, 0).
Slope (m) = (y2 - y1) / (x2 - x1)
m = (0 - 3) / (6 - 0)
m = -3/6
m = -1/2
Function C is having greater rate of change.
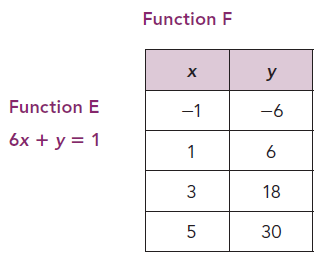
Problem 3 :
Solution :
Rate of change from equation E :
6x + y = 1
Converting the given equation into slope intercept form, we get
y = -6x + 1
Slope (m) = -6
Rate of change from equation F :
Two points from the graph (-1, -6) and (1, 6).
Change in y = (6 +6) ==> 12
Change in x = (1 + 1) ==> 2
Slope (m) = Change in y / change in x
Slope (m) = 12/2
m = 6
Equation F is having grater rate of change.
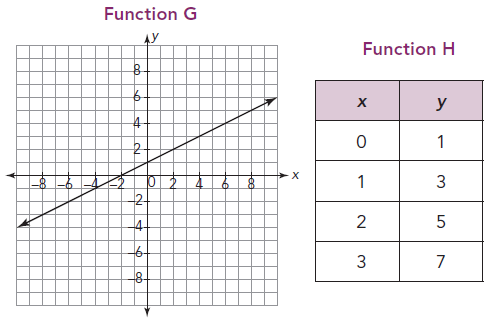
Problem 4 :
Alicia, Cherie, and John had been studying rates of change and were discussing the best way to determine which linear function has the greater rate of change.
Solution :
Rate of change from G :
Considering two points on the line (0, 1) and (4, 3).
Change in y = (3 - 1) ==> 2
Change in x = (4 - 0) ==> 4
Slope = 2/4 ==> 1/2
Rate of change from H :
Two points from the table are (0, 1) and (1, 3).
m = (3 - 1) / (1 - 0)
m = 2/1
m = 2
So, function H is having greater rate of change.
Problem 5 :
Match each description of the situation with its corresponding graph. Explain your reasoning.
a. A person gives $20 per week to a friend to repay a $200 loan.
b. An employee receives $12.50 per hour plus $2 for each unit produced per hour.
c. A sales representative receives $30 per day for food plus $0.565 for each mile driven.
d. A computer that was purchased for $750 depreciates $100 per year.

Solution :
Graph A :
- y-intercept = 30
- Slope = it is increasing line, so it must have positive slope.
Correct answer :
c) A sales representative receives $30 per day for food plus $0.565 for each mile driven.
Graph B :
- y-intercept = 200
- To find slope, we choose two points. (0, 200) and (9, 0)
- Slope = (0 - 200) / (9 - 0)
- -200/9 = 22.2 (approximatley)
Correct answer :
a) A person gives $20 per week to a friend to repay a $200 loan.
Graph C :
- y-intercept = 13 (approximately)
- To find slope, we choose two points. (0, 13) and (4, 20)
- Slope = (20 - 13) / (4 - 0)
- 7/4 = 1.75 (approximatley)
Correct answer :
b) An employee receives $12.50 per hour plus $2 for each unit produced per hour.
Graph D :
- y-intercept = 750(approximately)
- To find slope, we choose two points. (0, 13) and (4, 20)
- Slope = (20 - 13) / (4 - 0)
- 7/4 = 1.75 (approximatley)
Correct answer :
d) A computer that was purchased for $750 depreciates $100 per year.
Problem 6 :
The function C(x) = 17.5x − 10 represents the cost (in dollars) of buying x tickets to the orchestra with a $10 coupon.
a. How much does it cost to buy five tickets?
b. How many tickets can you buy with $130?
Solution :
C(x) = 17.5x − 10
Here x is the number of tickets.
a) Number of tickets = 5
C(5) = 17.5(5) - 10
= 87.5 - 10
= 77.5
b) C(x) = 130
130 = 17.5x − 10
130 + 10 = 17.5x
140 = 17.5x
x = 140/17.5
x = 8
Problem 7 :
Account A earns simple interest. Account B earns compound interest. The table shows the balances for 5 years. Graph the data and compare the graphs.

Solution :
The balance of Account A has a constant rate of change of $10. So, the function representing the balance of Account A is linear.
The balance of Account B increases by different amounts each year. Because the rate of change is not constant, the function representing the balance of Account B is nonlinear.
Subscribe to our ▶️ YouTube channel 🔴 for the latest videos, updates, and tips.
Recent Articles
-
Finding Range of Values Inequality Problems
May 21, 24 08:51 PM
Finding Range of Values Inequality Problems -
Solving Two Step Inequality Word Problems
May 21, 24 08:51 AM
Solving Two Step Inequality Word Problems -
Exponential Function Context and Data Modeling
May 20, 24 10:45 PM
Exponential Function Context and Data Modeling