COMPARING DOT PLOTS VISUALLY WORKSHEET
Subscribe to our ▶️ YouTube channel 🔴 for the latest videos, updates, and tips.
Problem 1 :
The dot plots show the heights of 15 high school basketball players and the heights of 15 high school softball players.
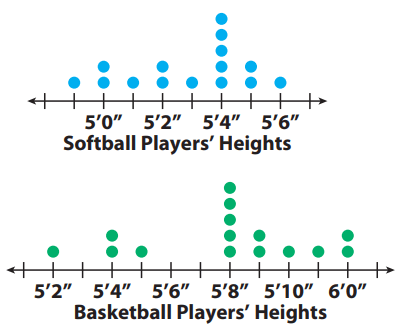
1) Visually compare the shapes of the dot plots
2) Visually compare the centers of the dot plots.
3) Visually compare the spreads of the dot plots.
Problem 2 :
Visually compare the dot plot of heights of field hockey players to the dot plots for softball and basketball players.
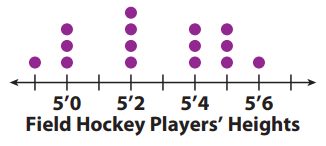
1) Spread
2) Shape
3) Center
Problem 3 :
Numerically compare the dot plots of the number of hours a class of students exercises each week to the number of hours they play video games each week.
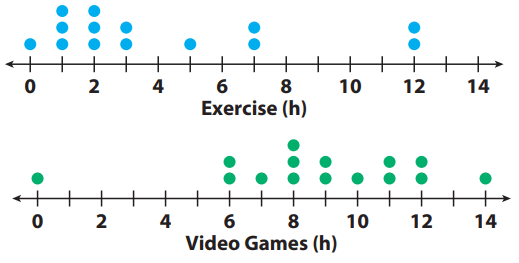
1) Compare the shapes of the dot plots.
2) Compare the centers of the dot plots by finding the medians.
3) Compare the spreads of the dot plots by calculating the range.
Problem 4 :
Calculate the median and range of the data in the dot plot.

Problem 5 :
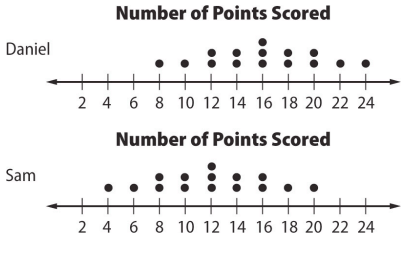
The double dot plot shows the number of points scored by Sam and Daniel in 15 basketball games. What is the difference between the medians?
Problem 6 :
The dot plots show the number of miles run per week for two different classes. For 1–5, use the dot plots shown.
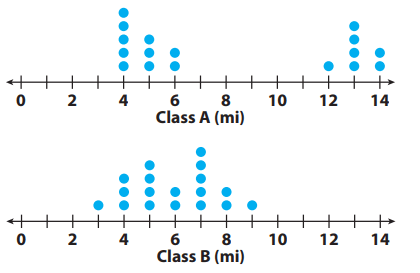
1. Compare the shapes of the dot plots.
2. Compare the centers of the dot plots.
3. Compare the spreads of the dot plots.
4. Calculate the medians of the dot plots.
5. Calculate the ranges of the dot plots
Subscribe to our ▶️ YouTube channel 🔴 for the latest videos, updates, and tips.
Recent Articles
-
Finding Range of Values Inequality Problems
May 21, 24 08:51 PM
Finding Range of Values Inequality Problems -
Solving Two Step Inequality Word Problems
May 21, 24 08:51 AM
Solving Two Step Inequality Word Problems -
Exponential Function Context and Data Modeling
May 20, 24 10:45 PM
Exponential Function Context and Data Modeling